openITCOCKPIT Screenshots

Screenshots

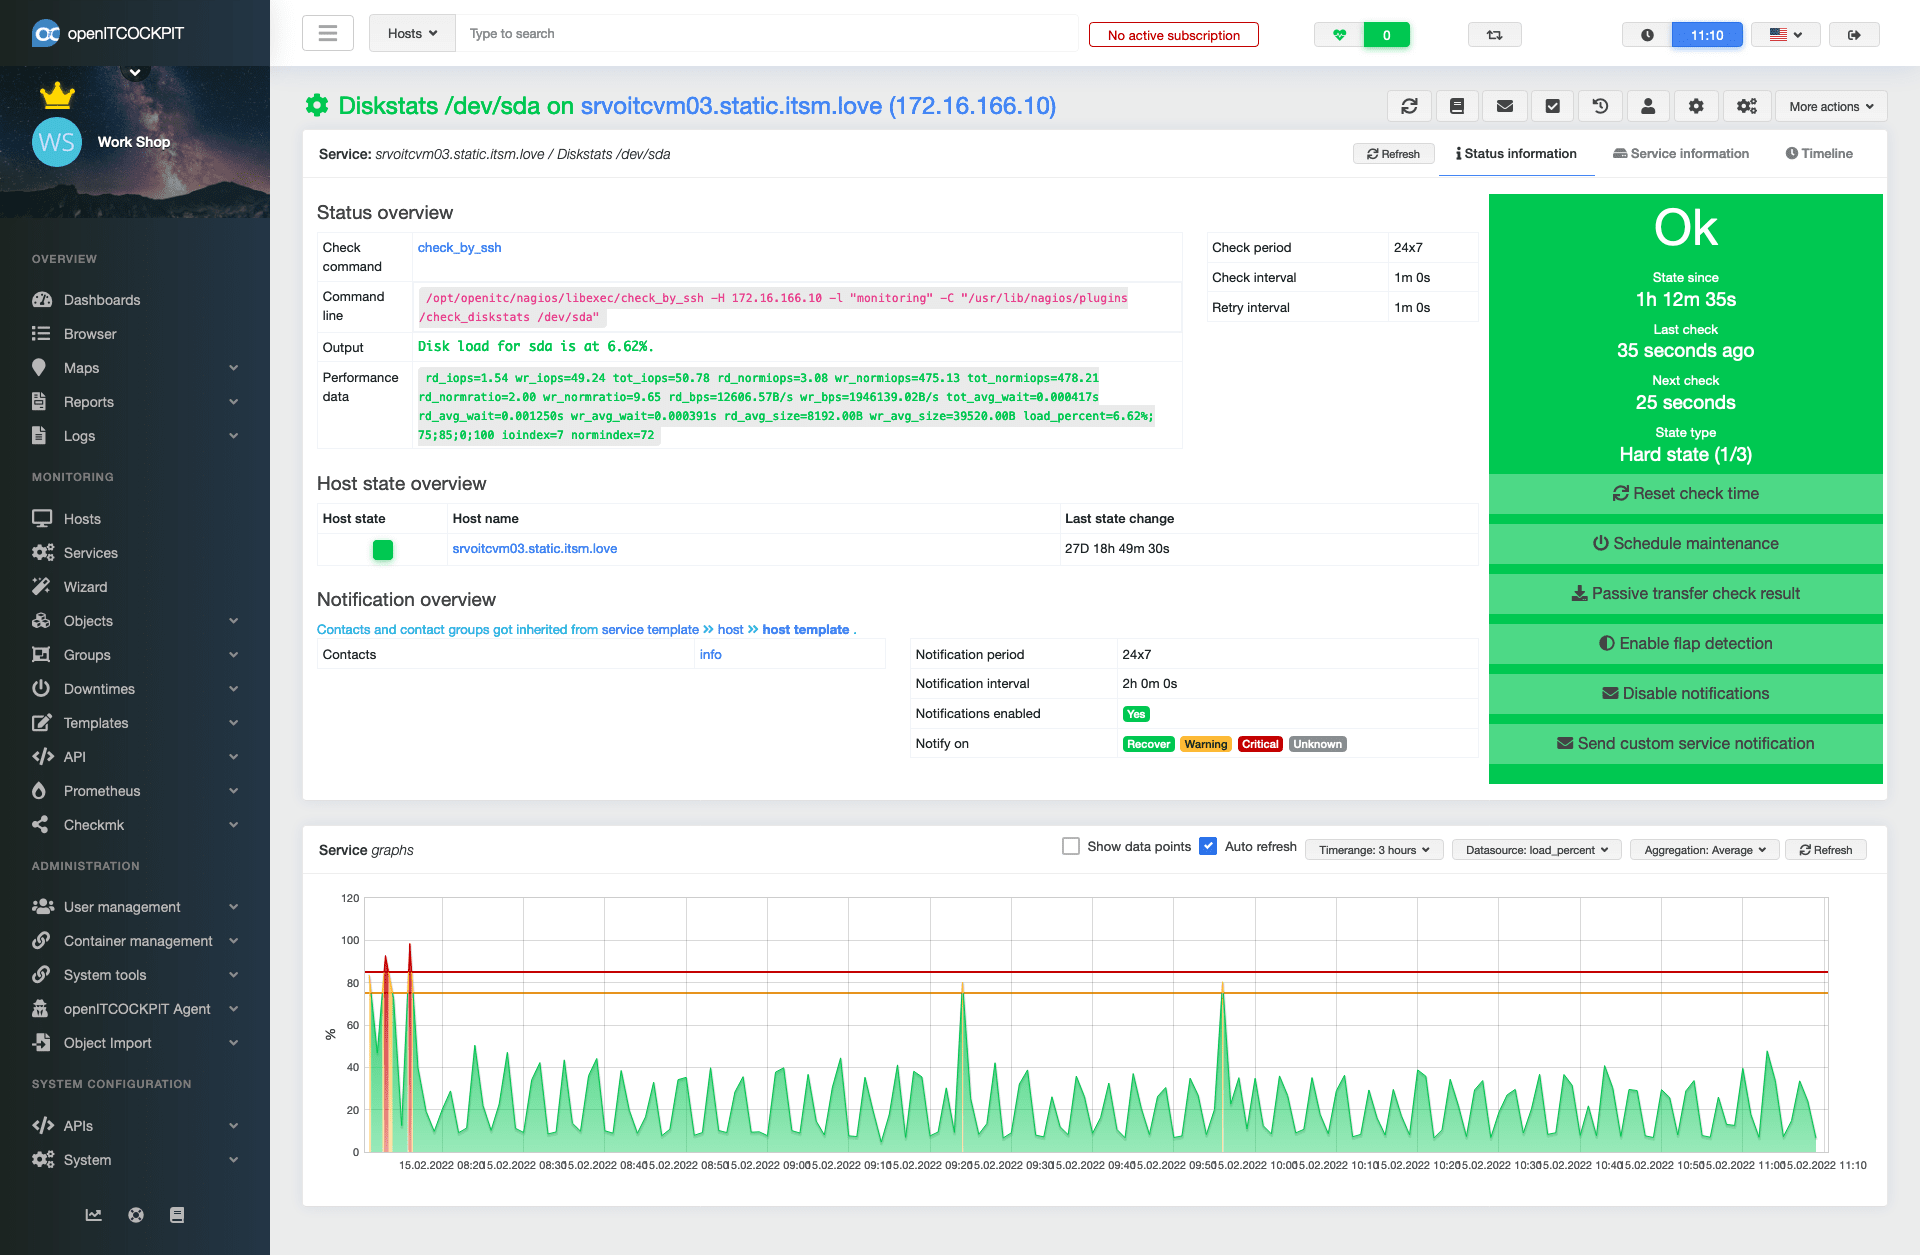
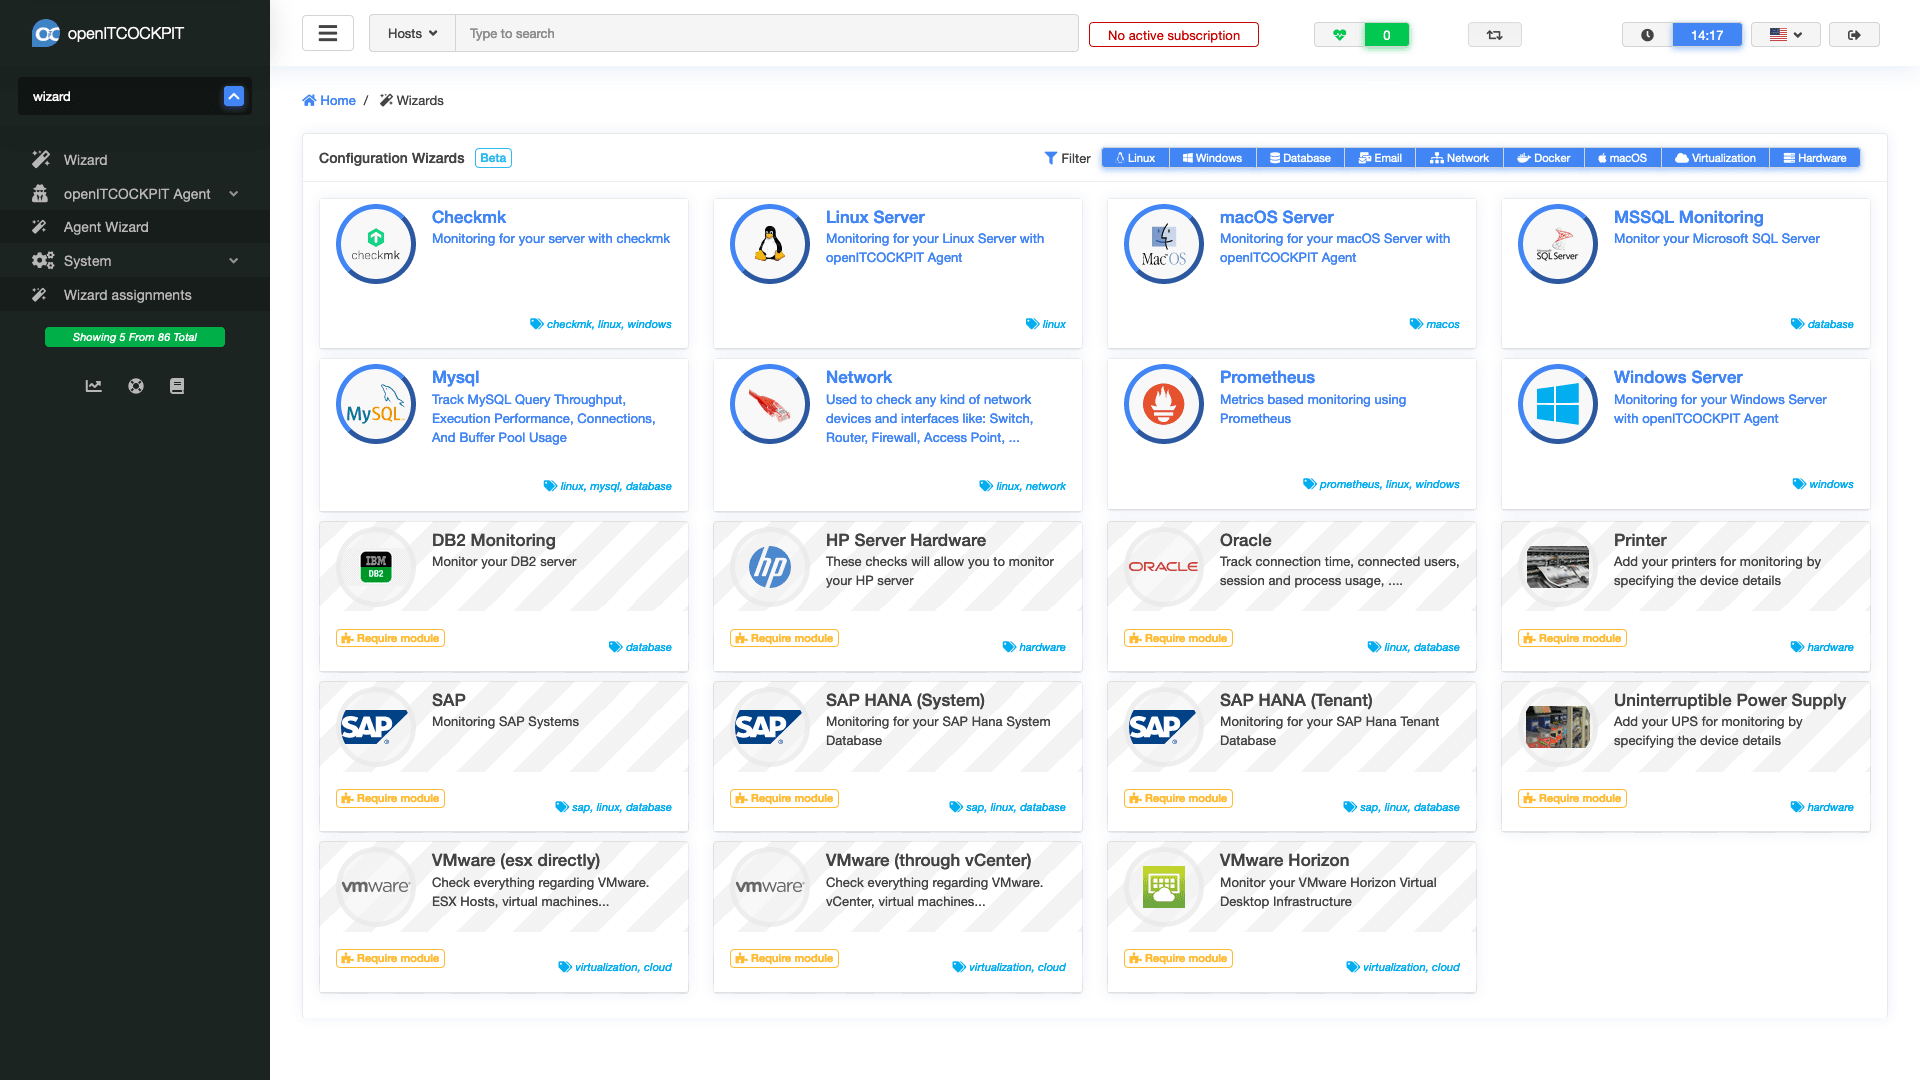
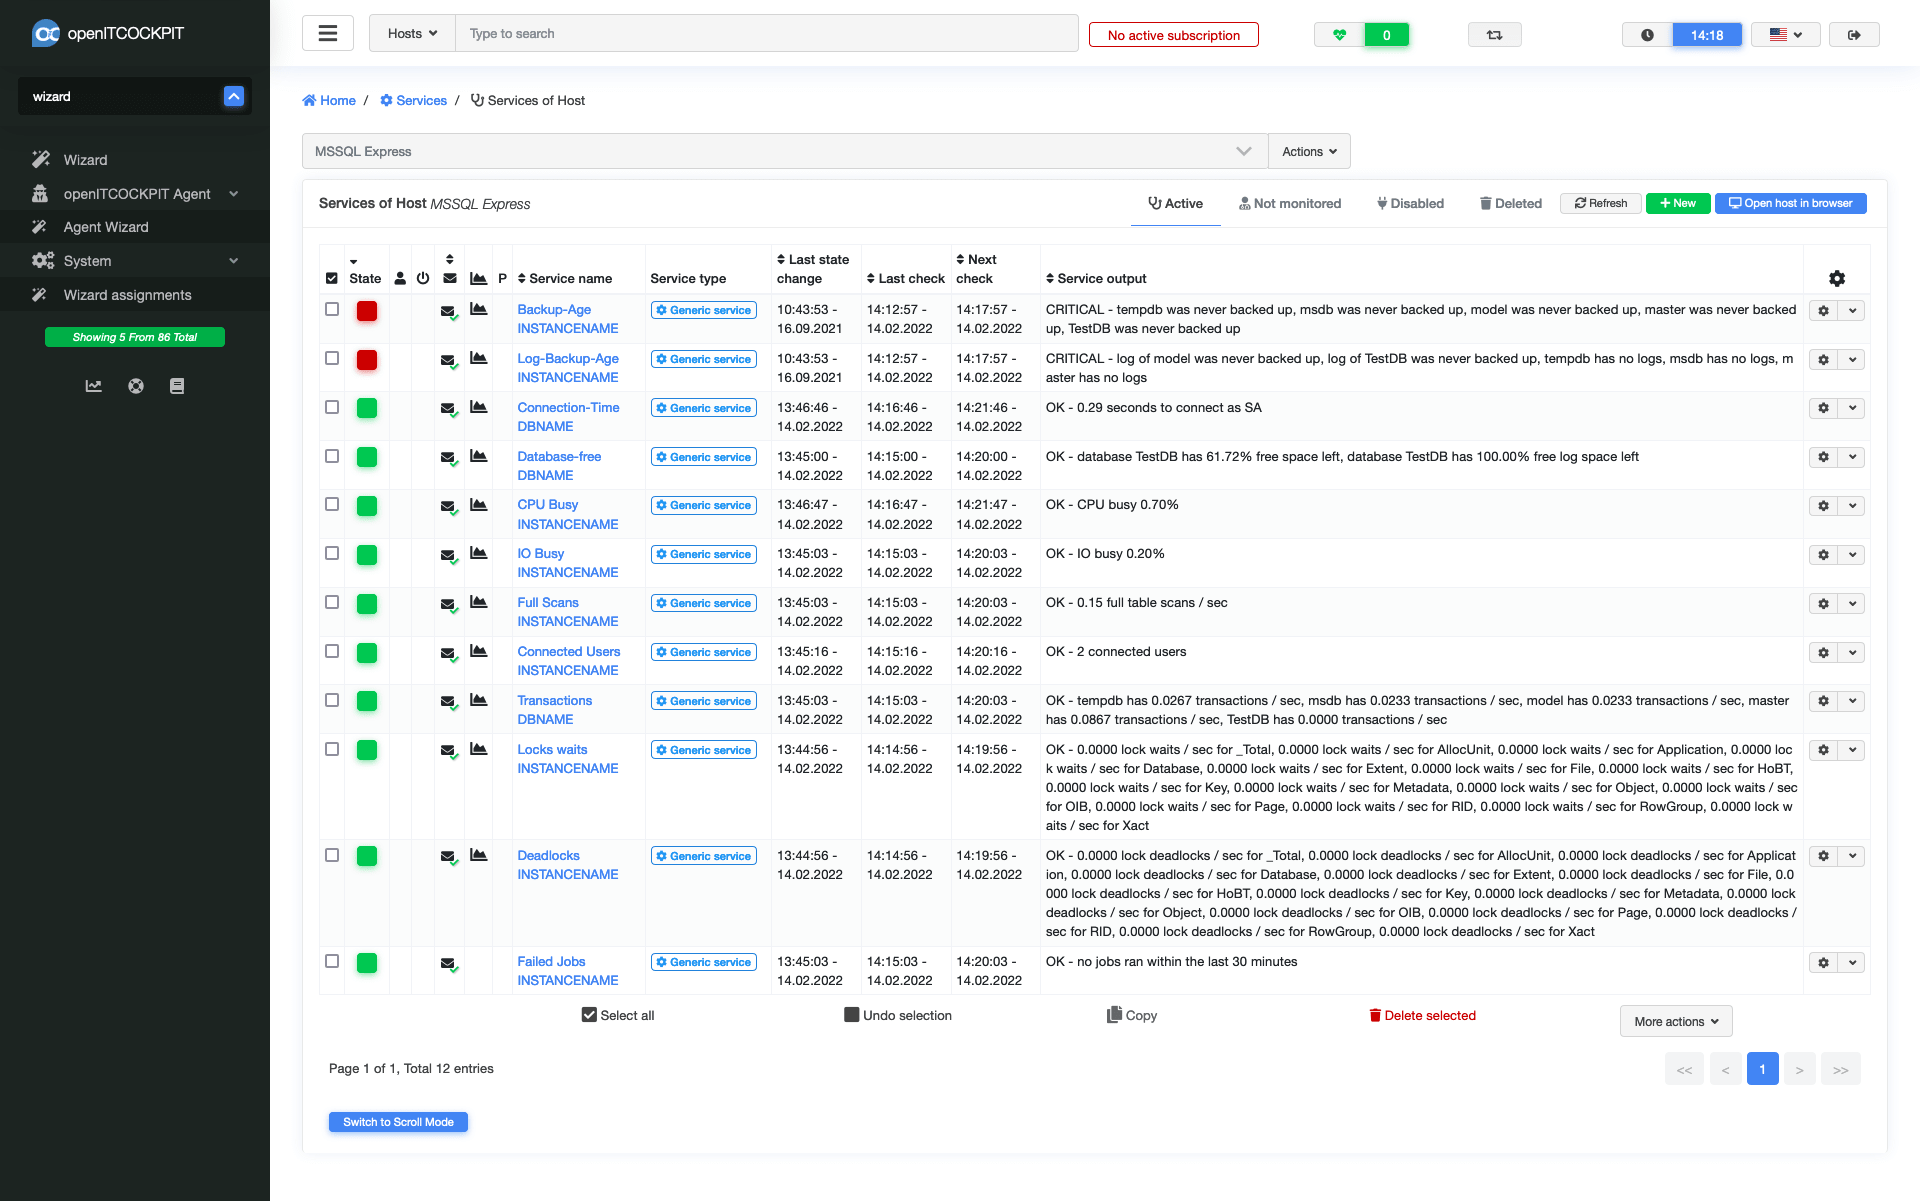
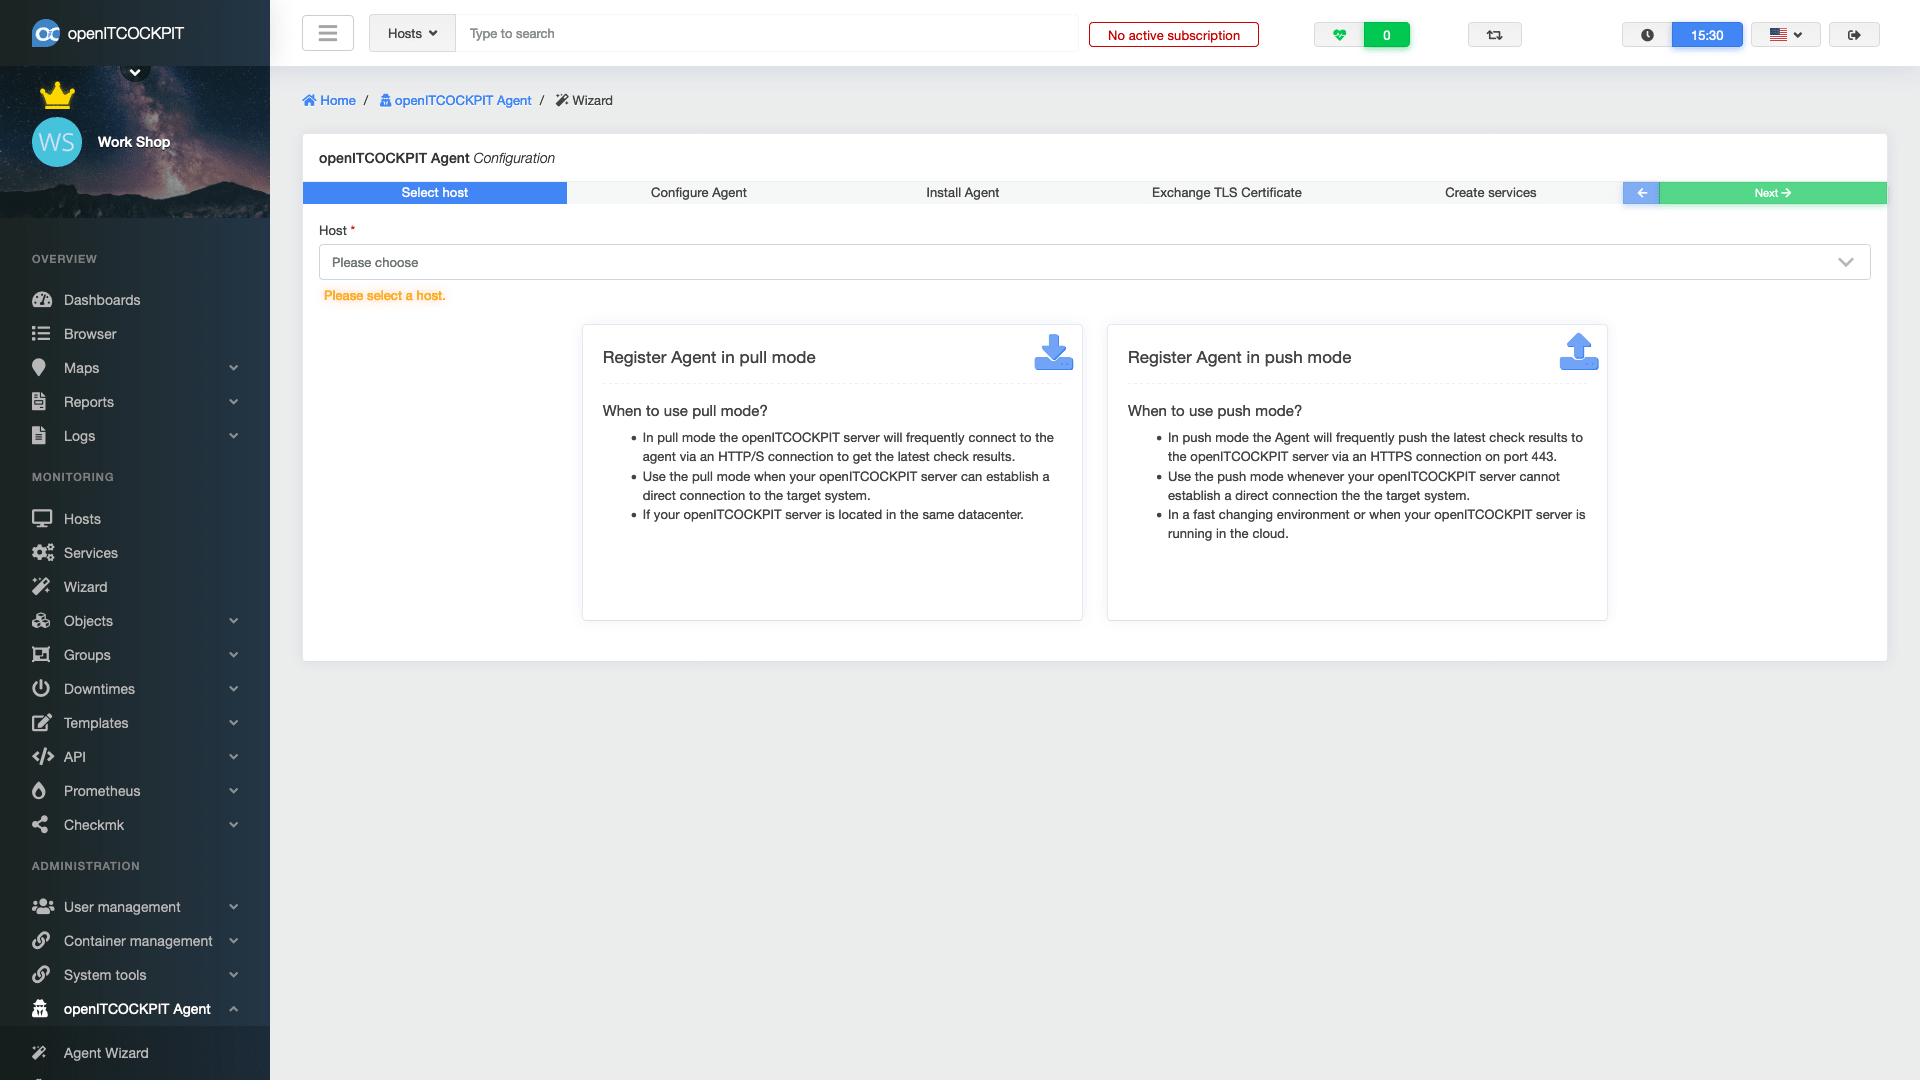
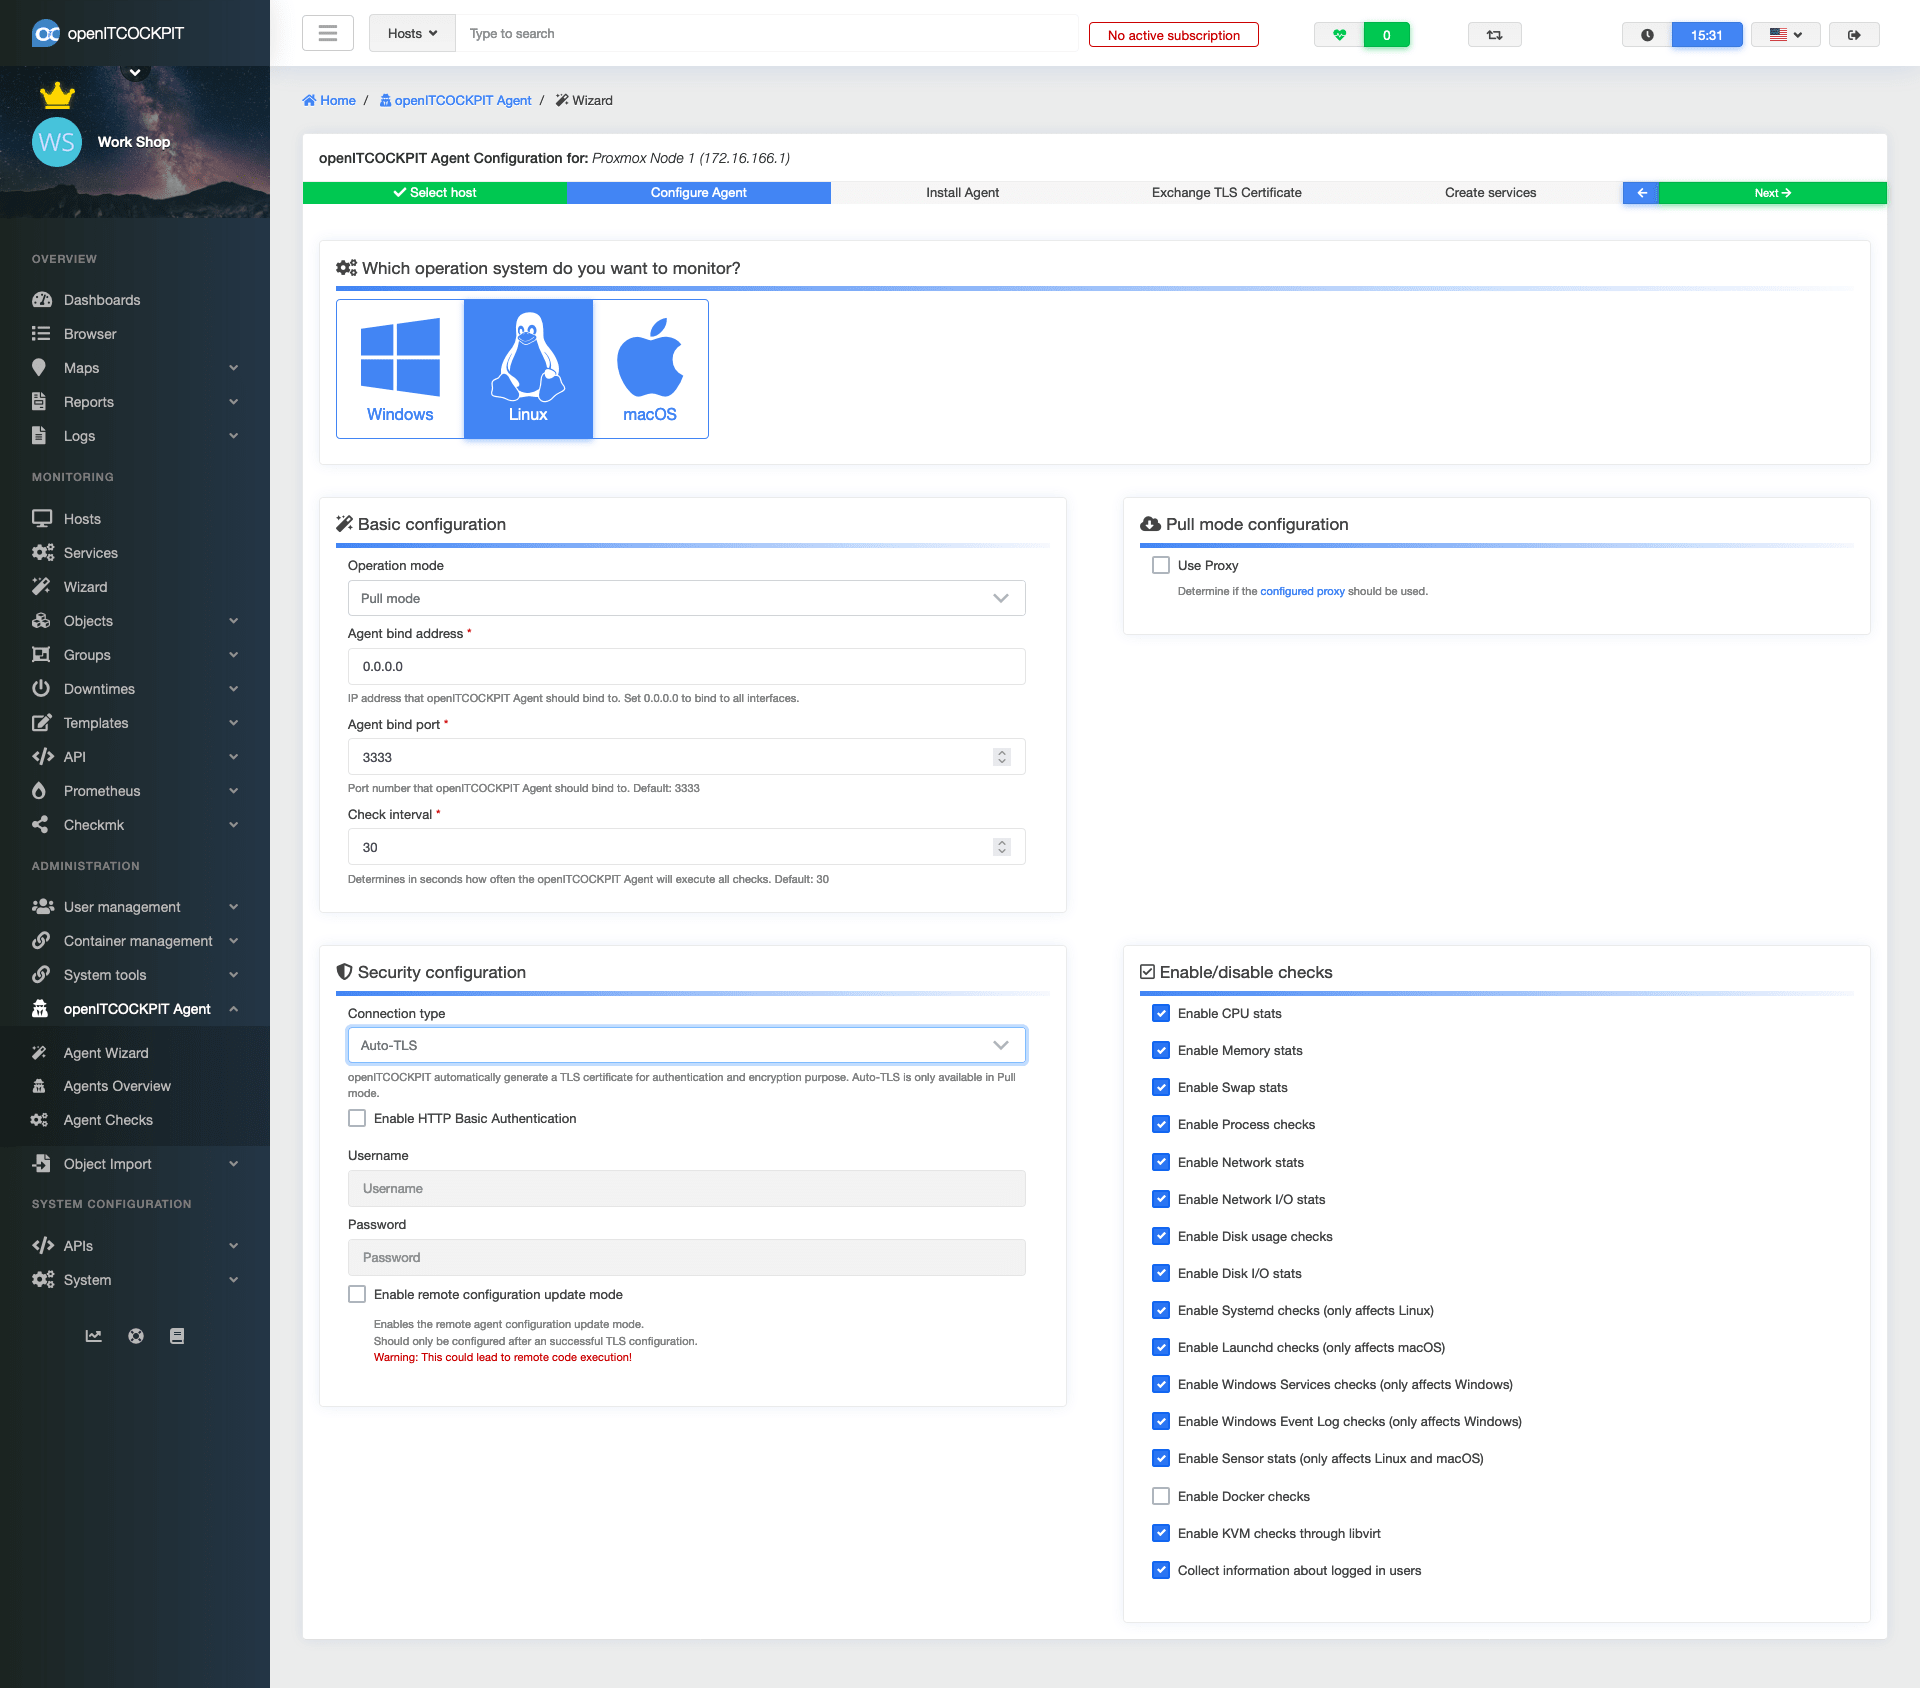
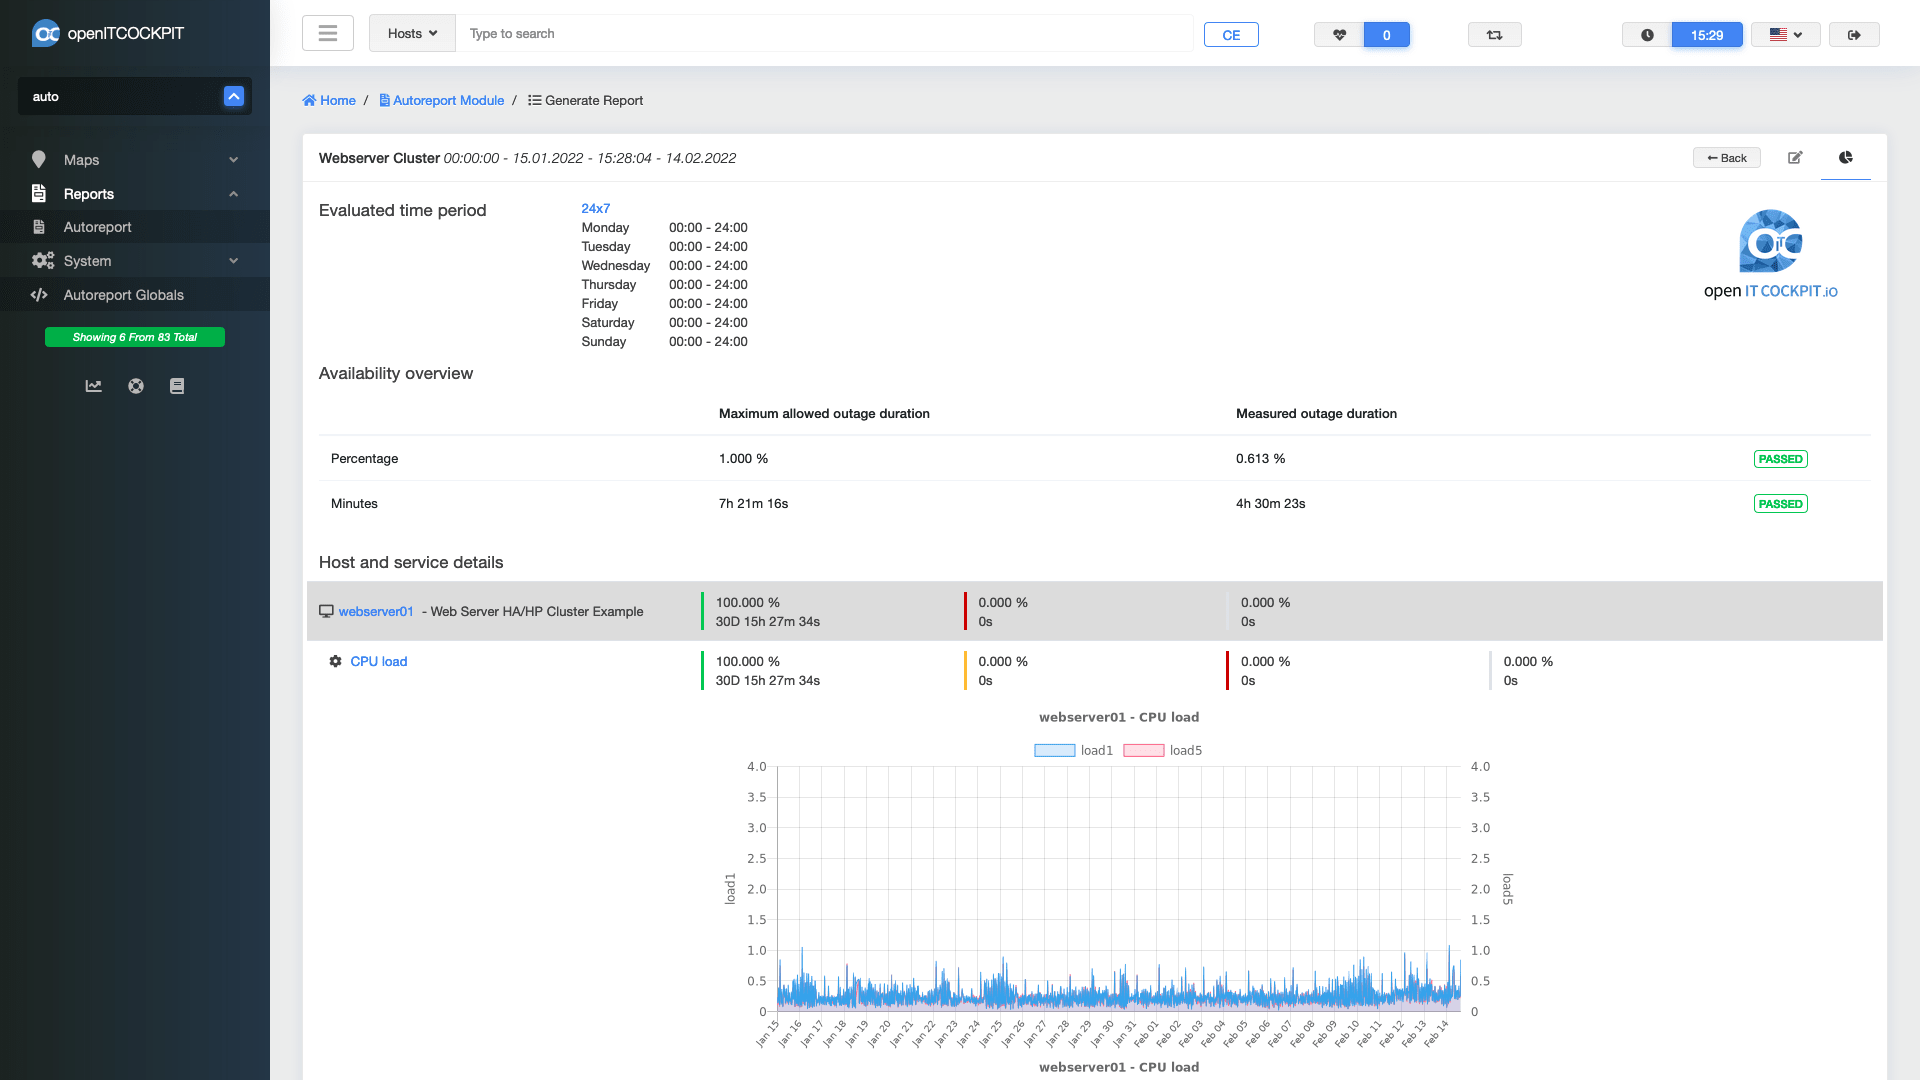
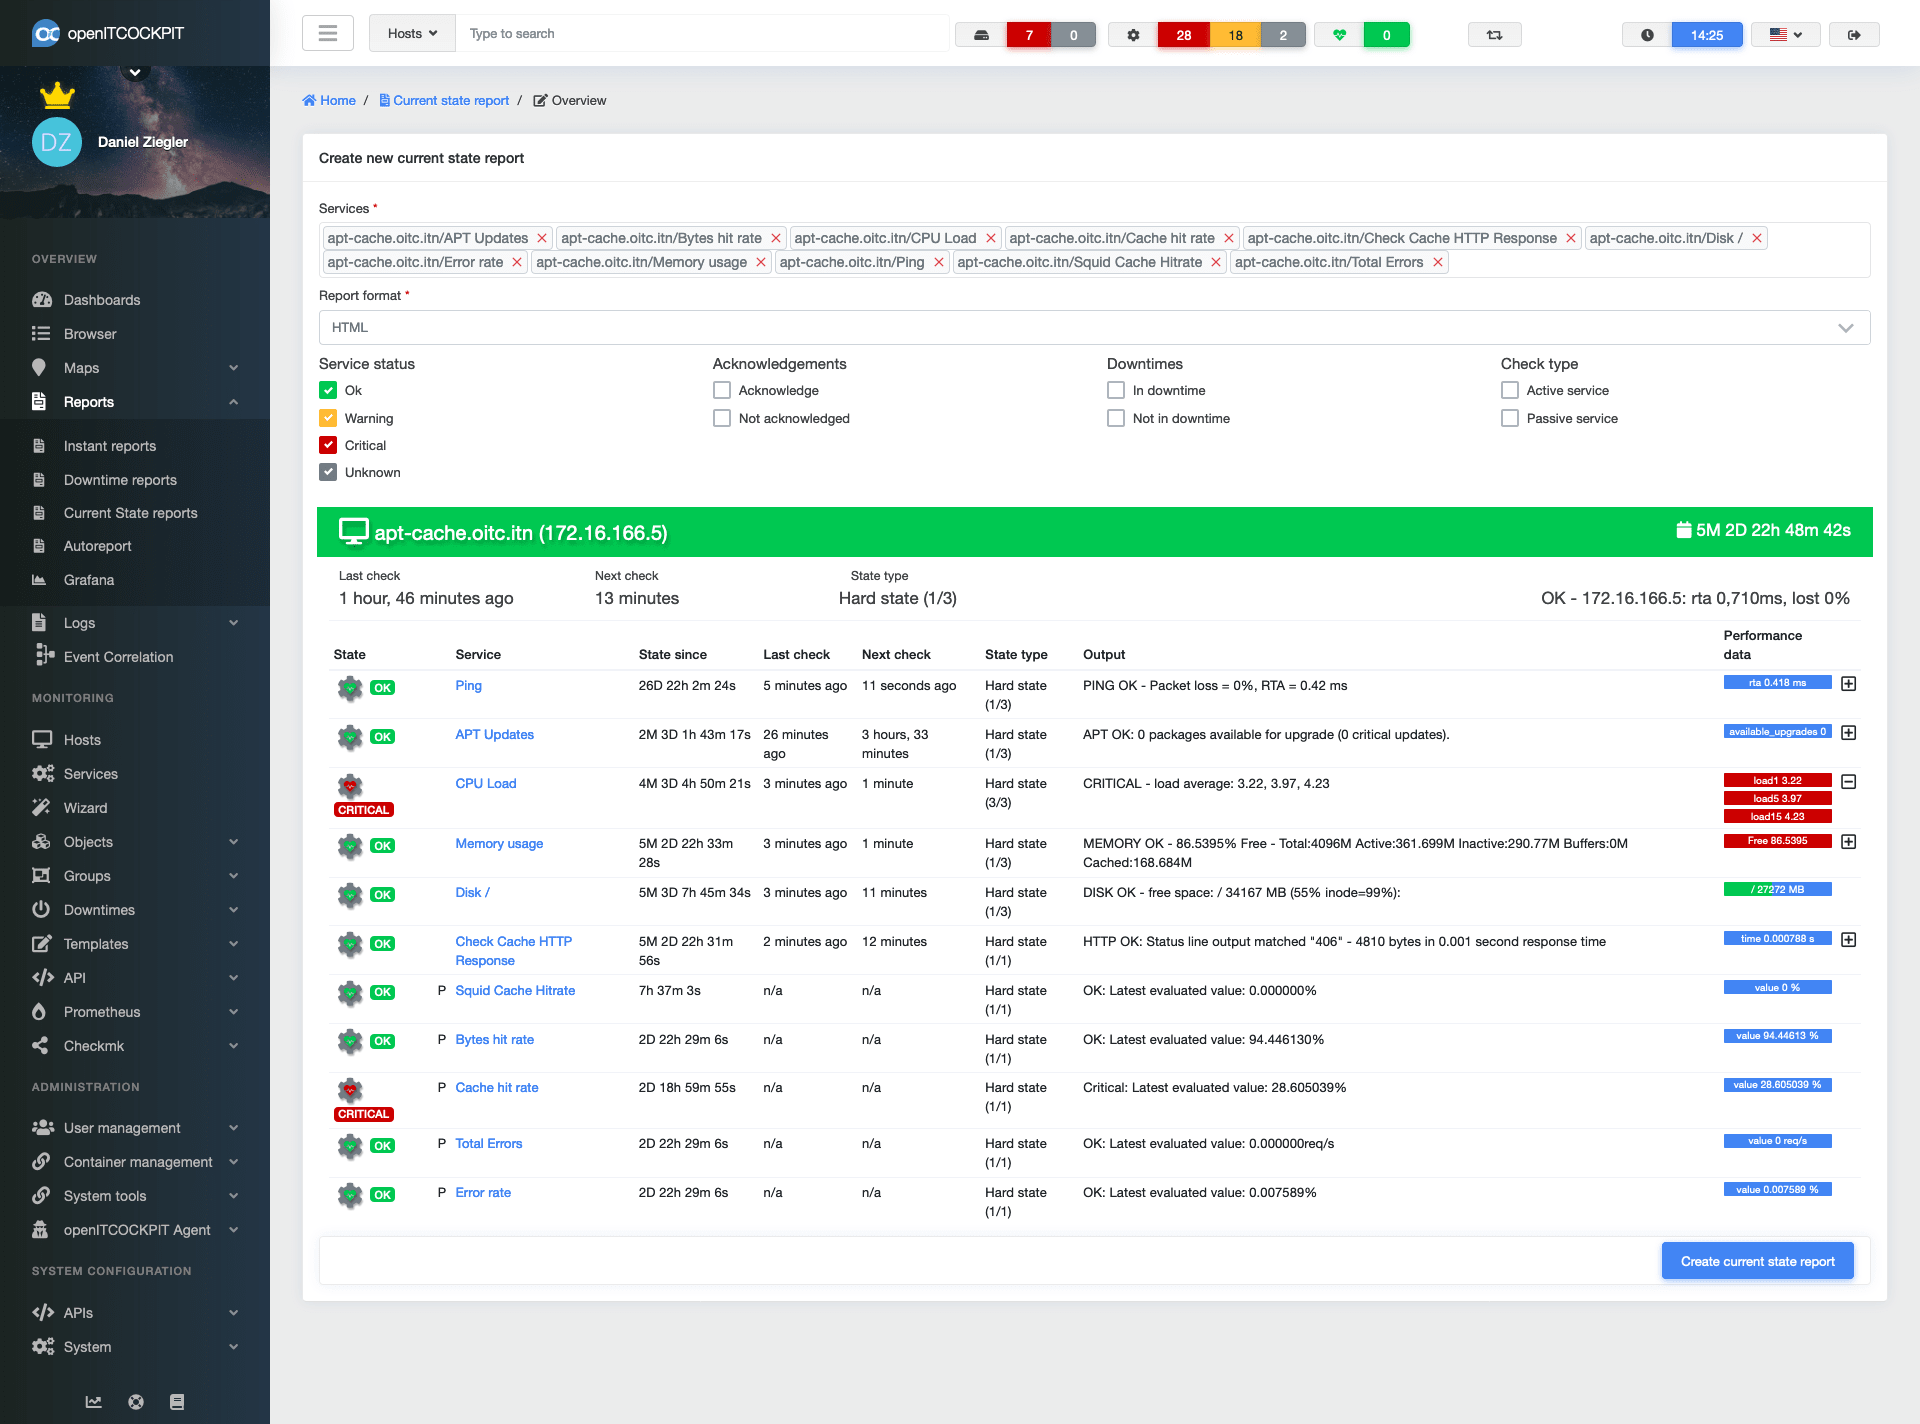
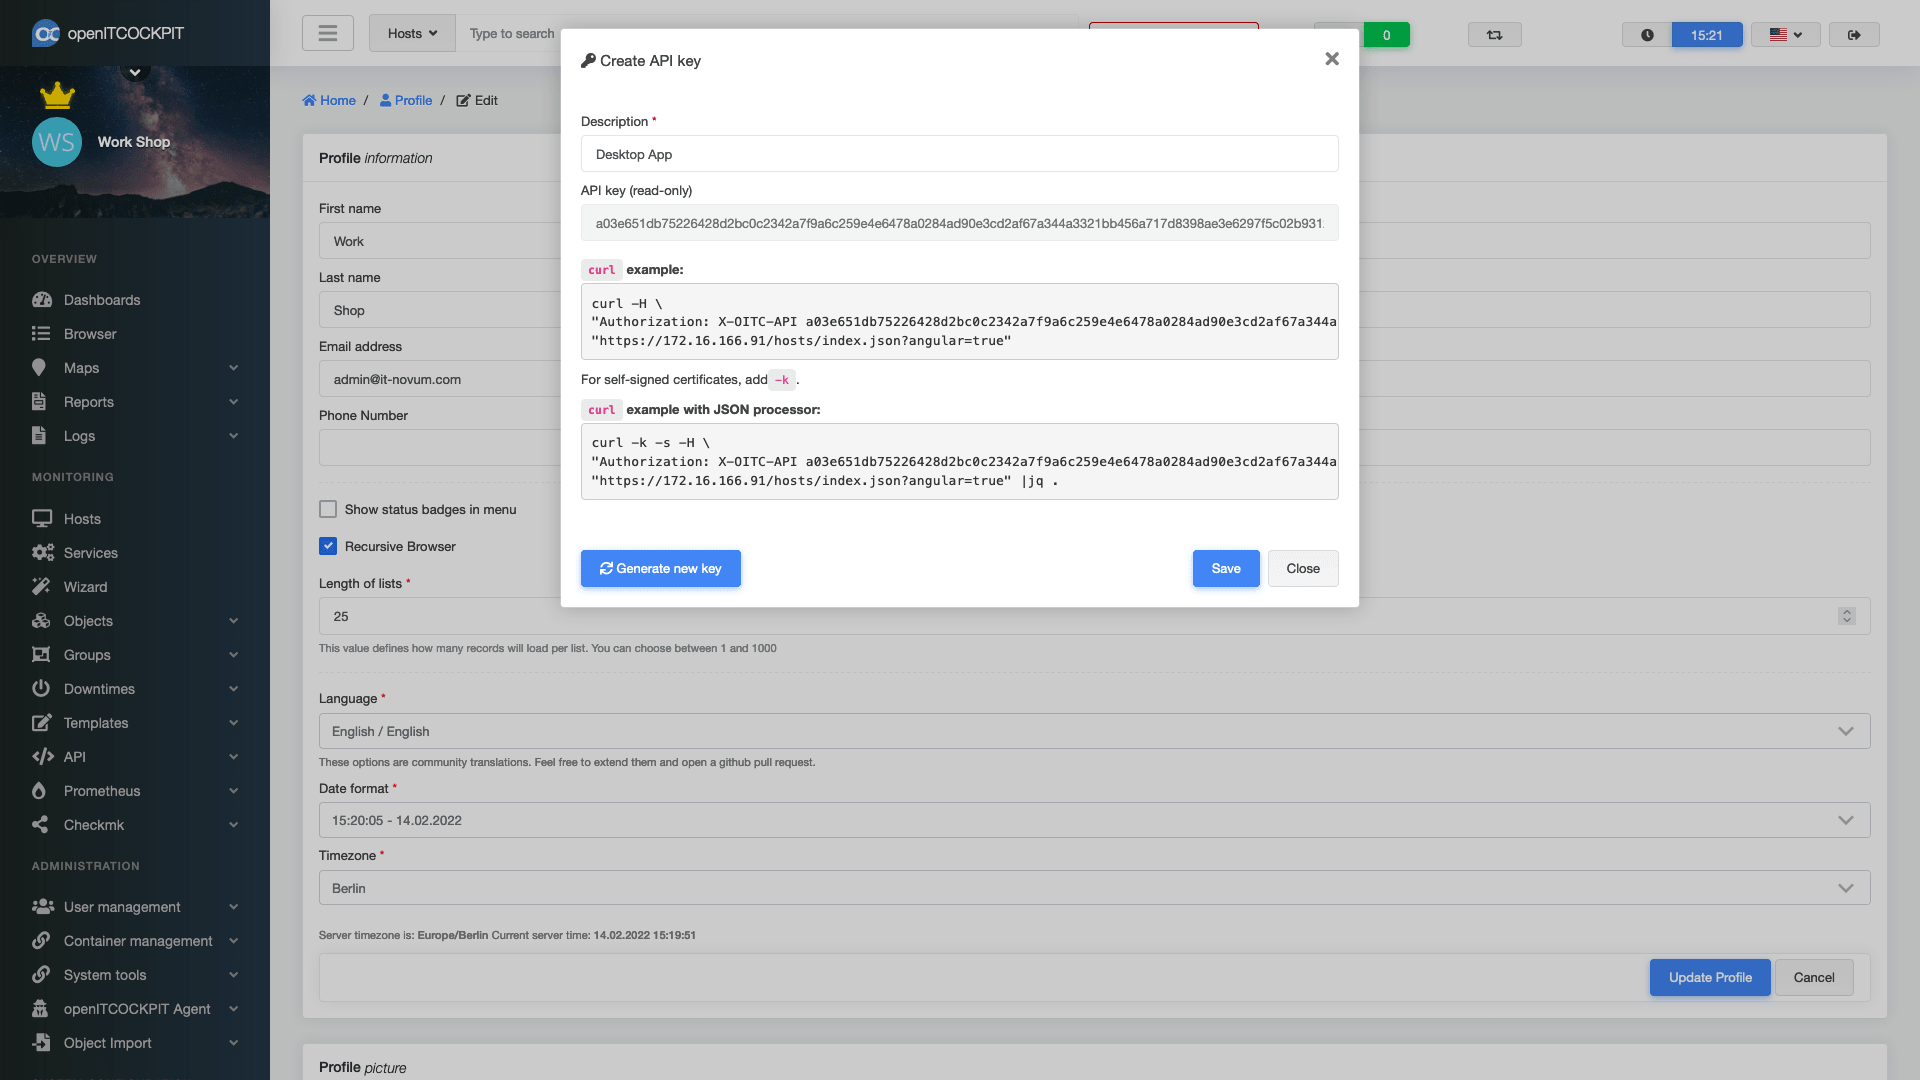
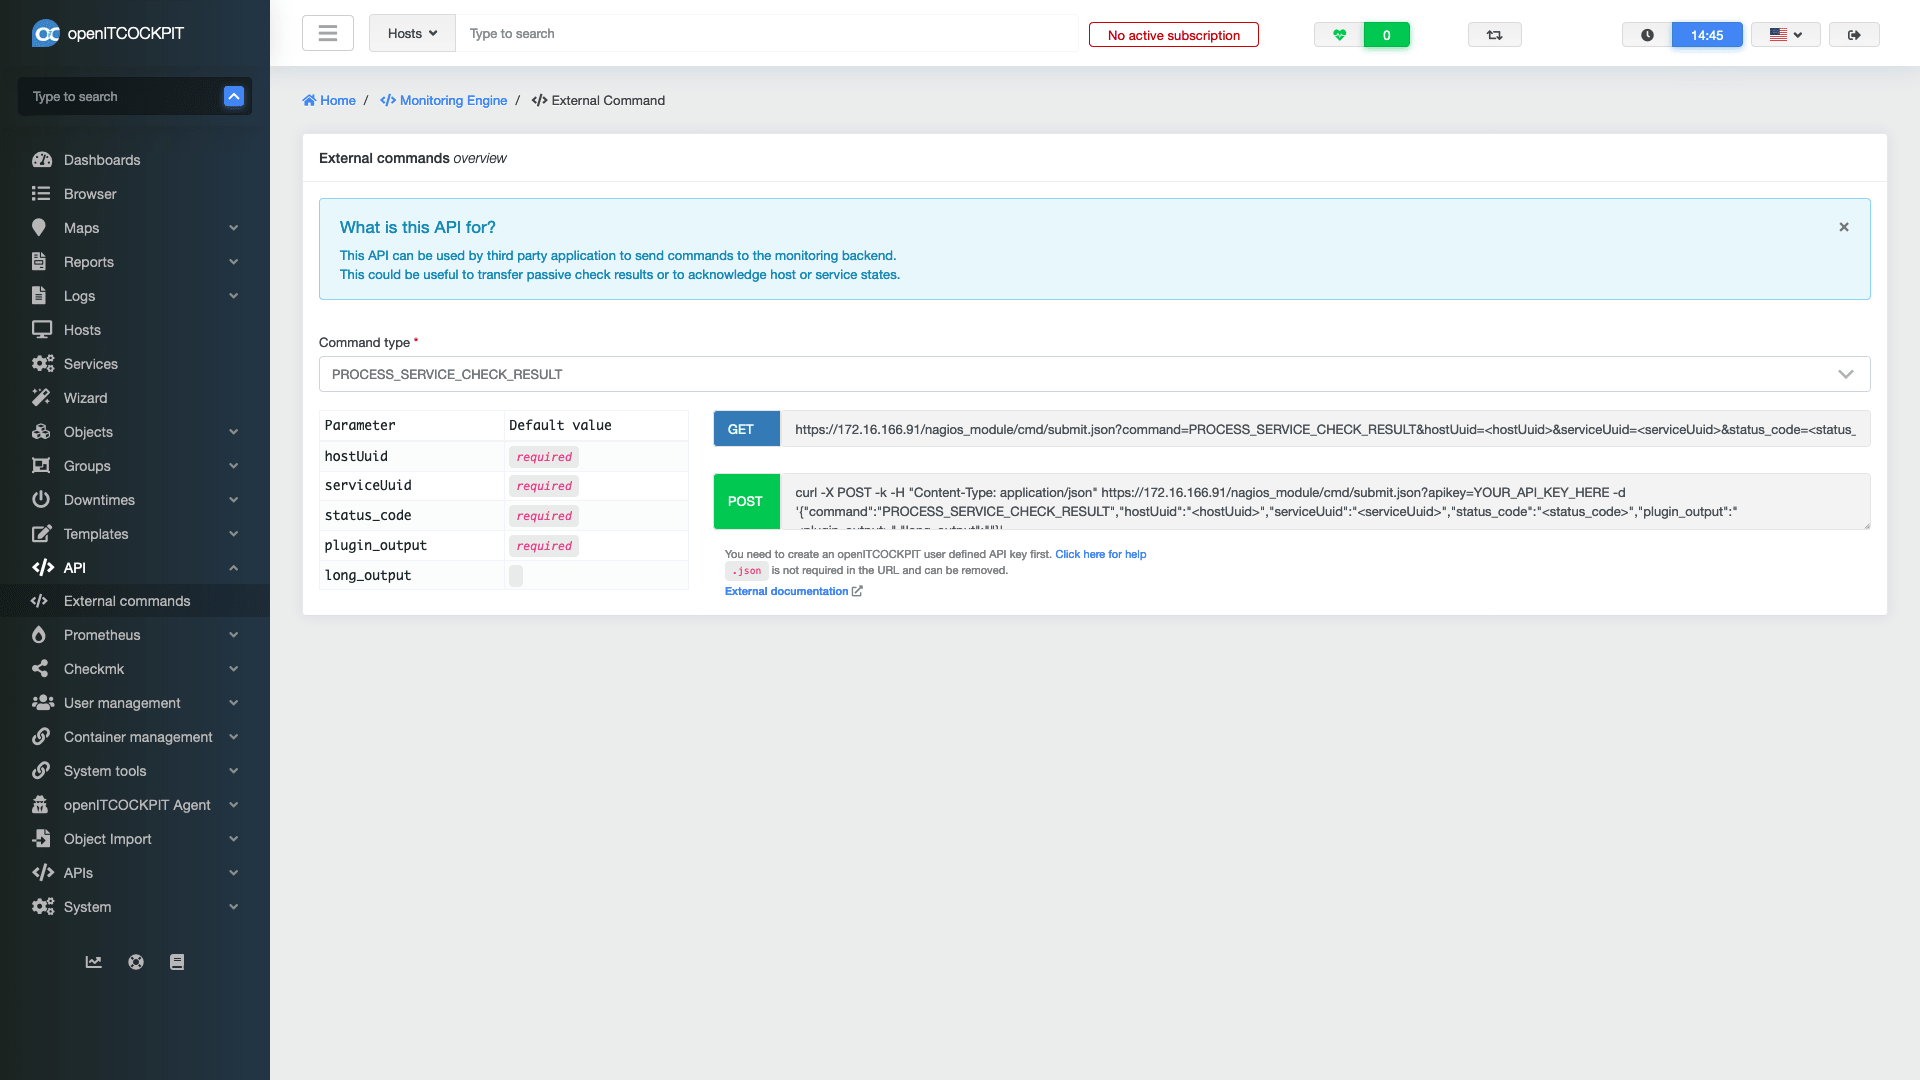
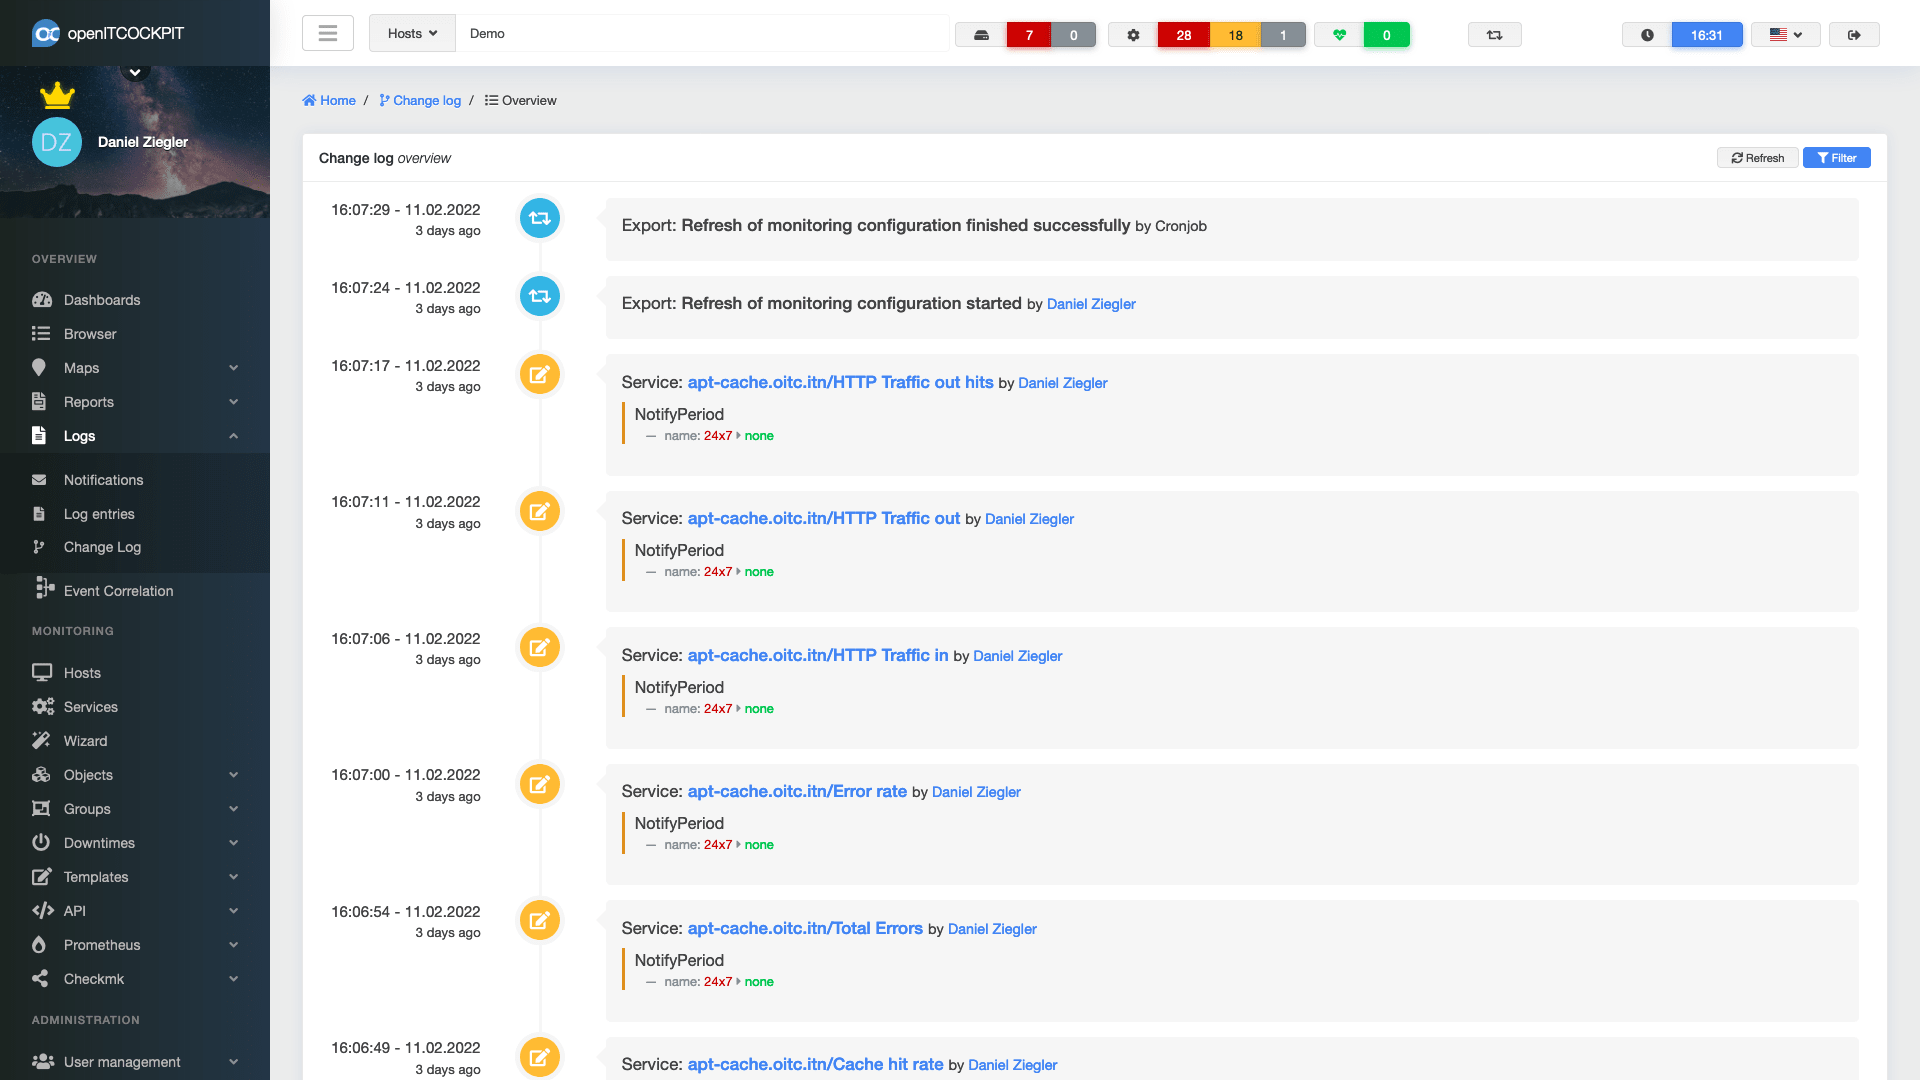
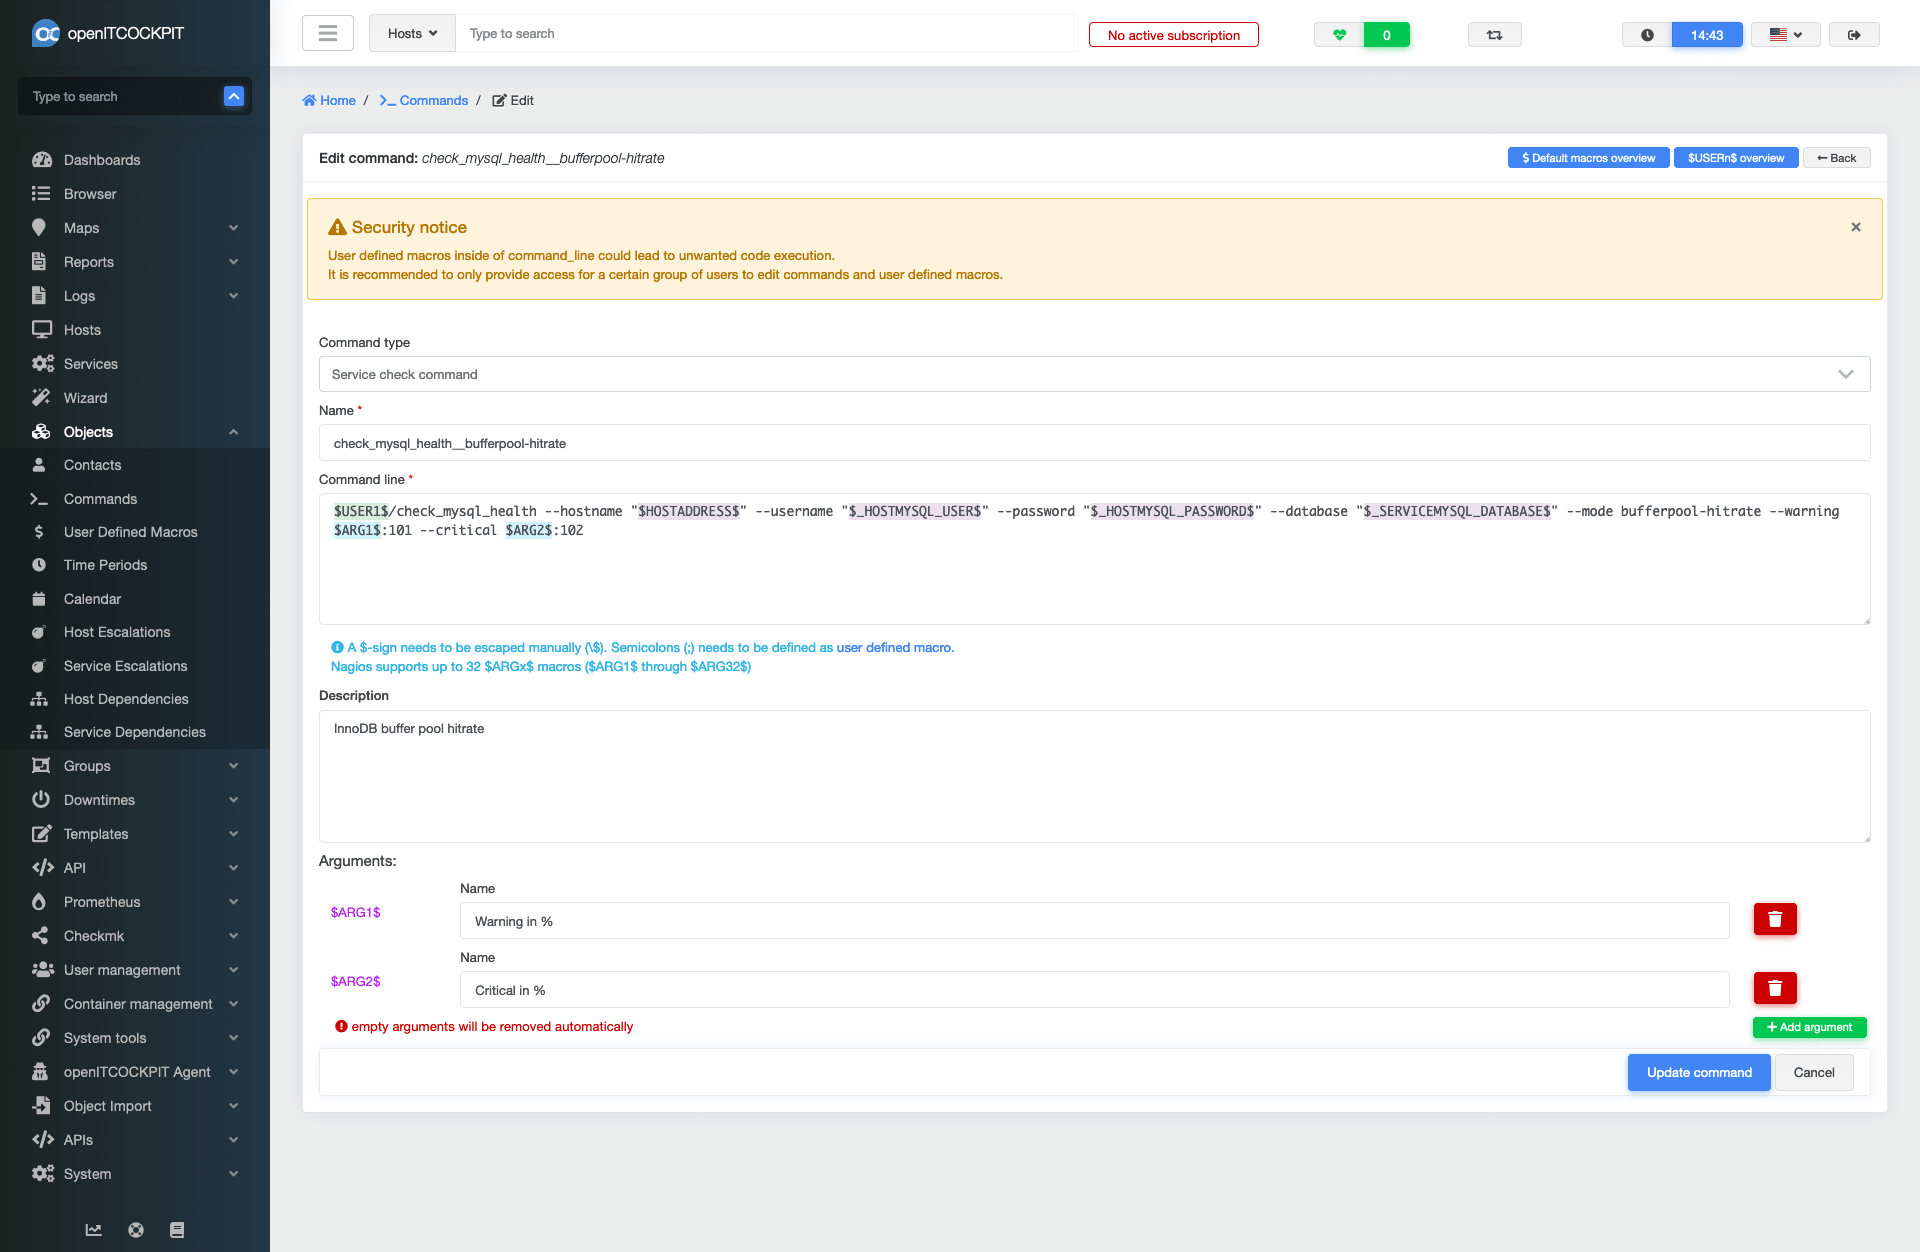
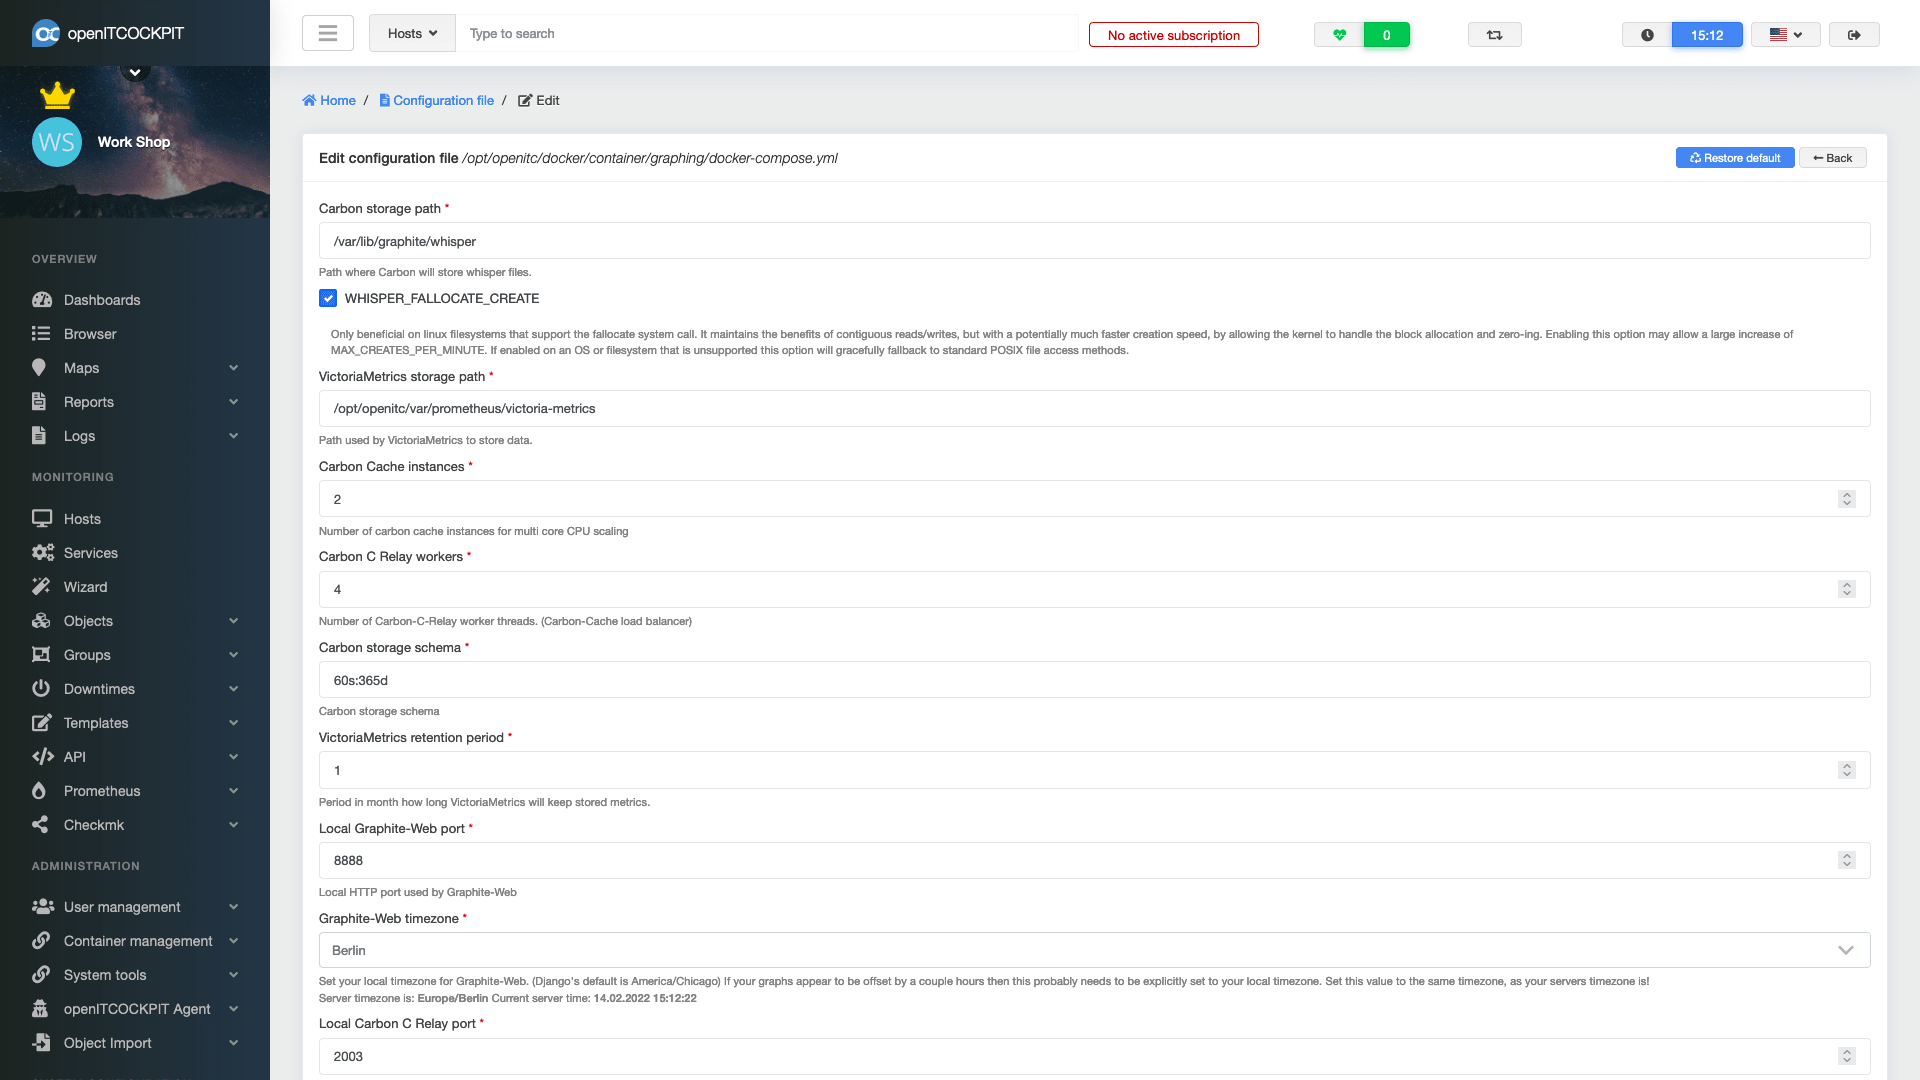
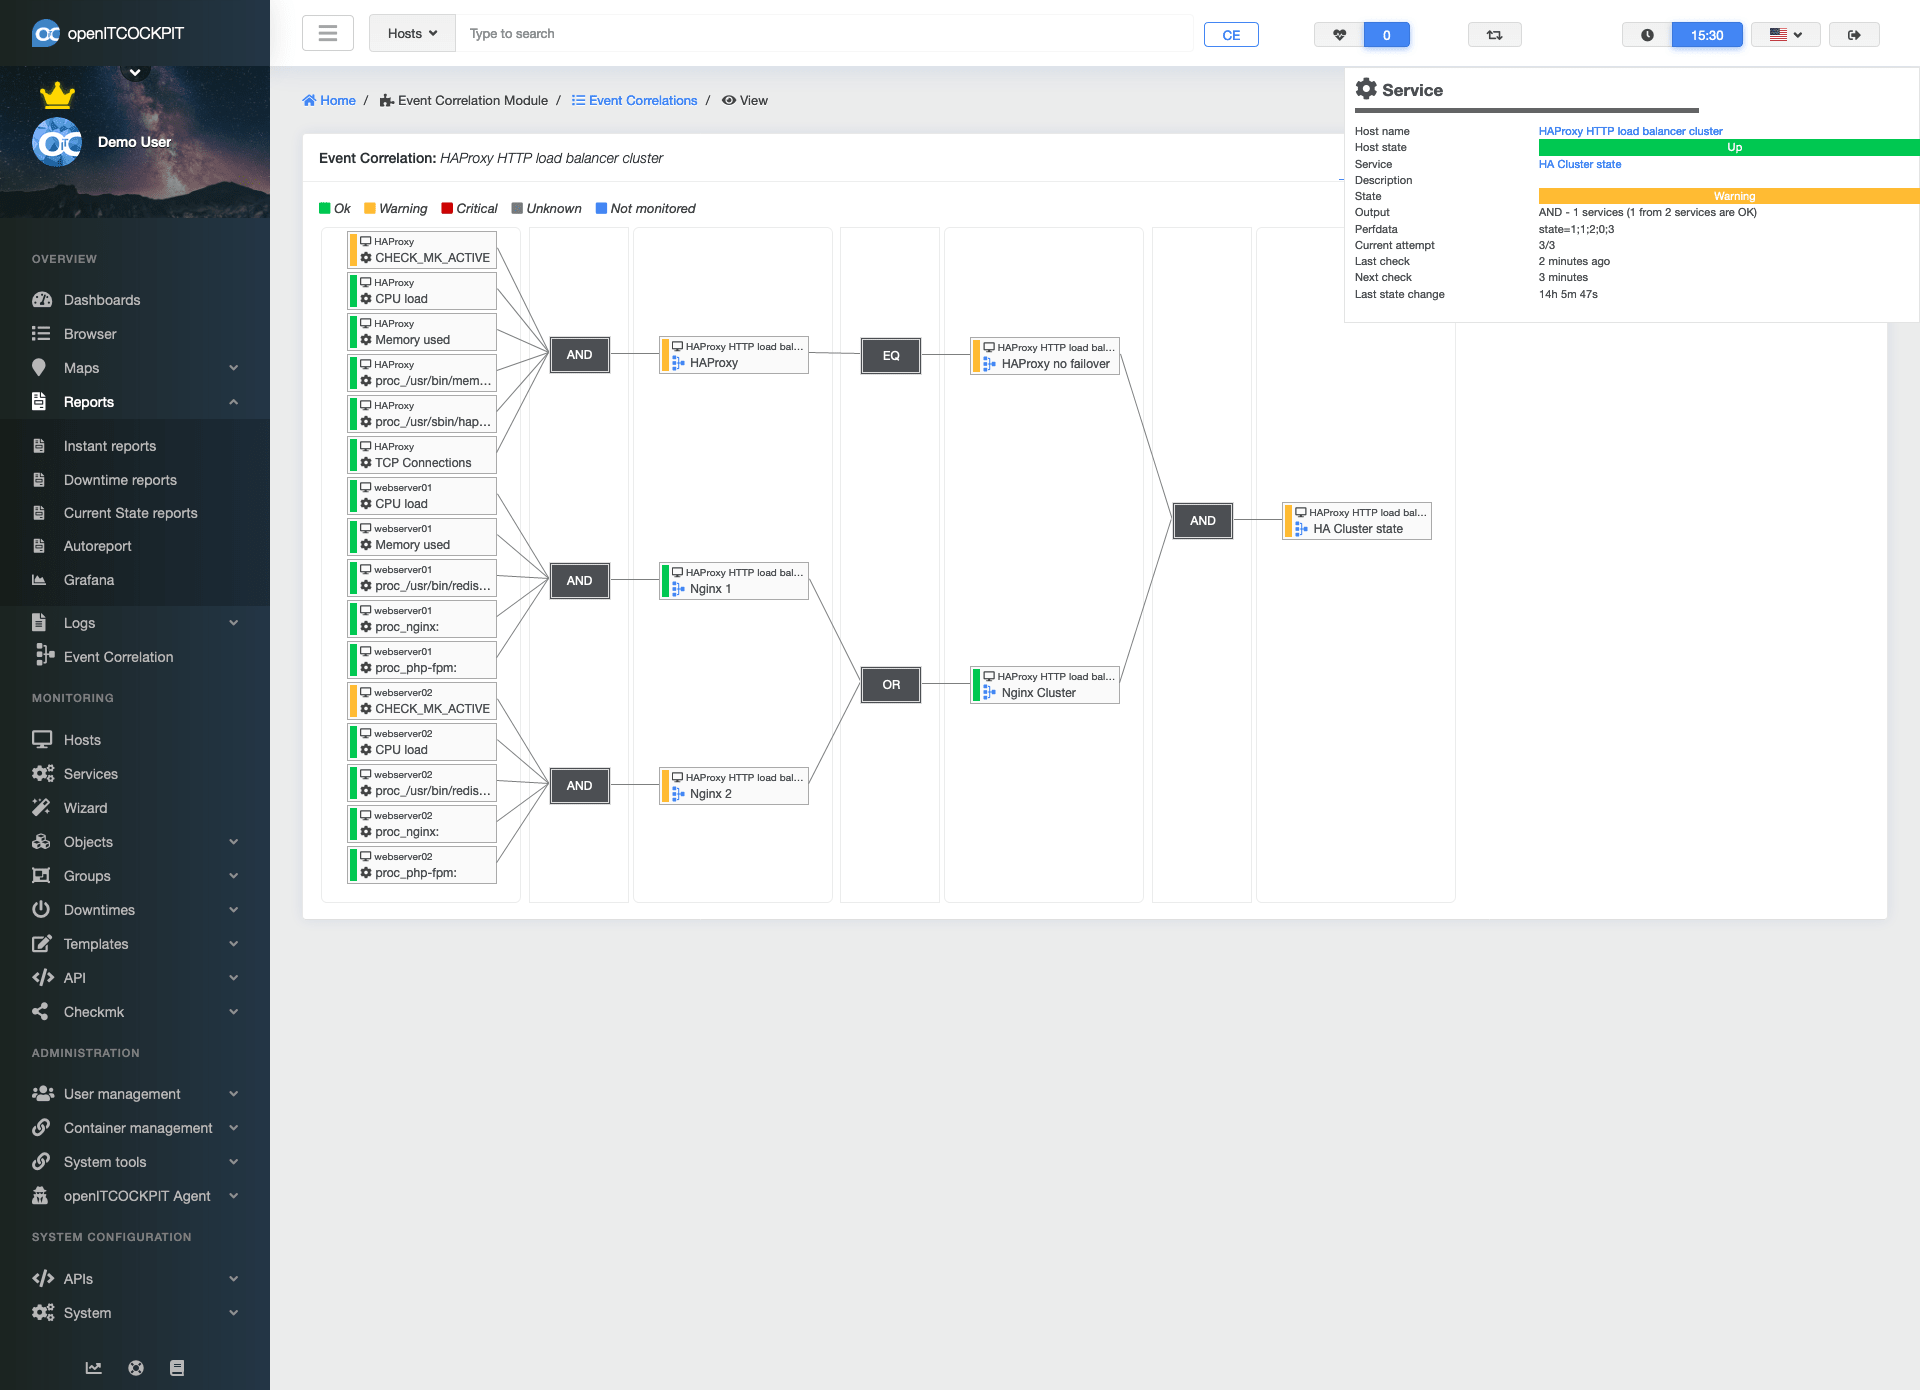
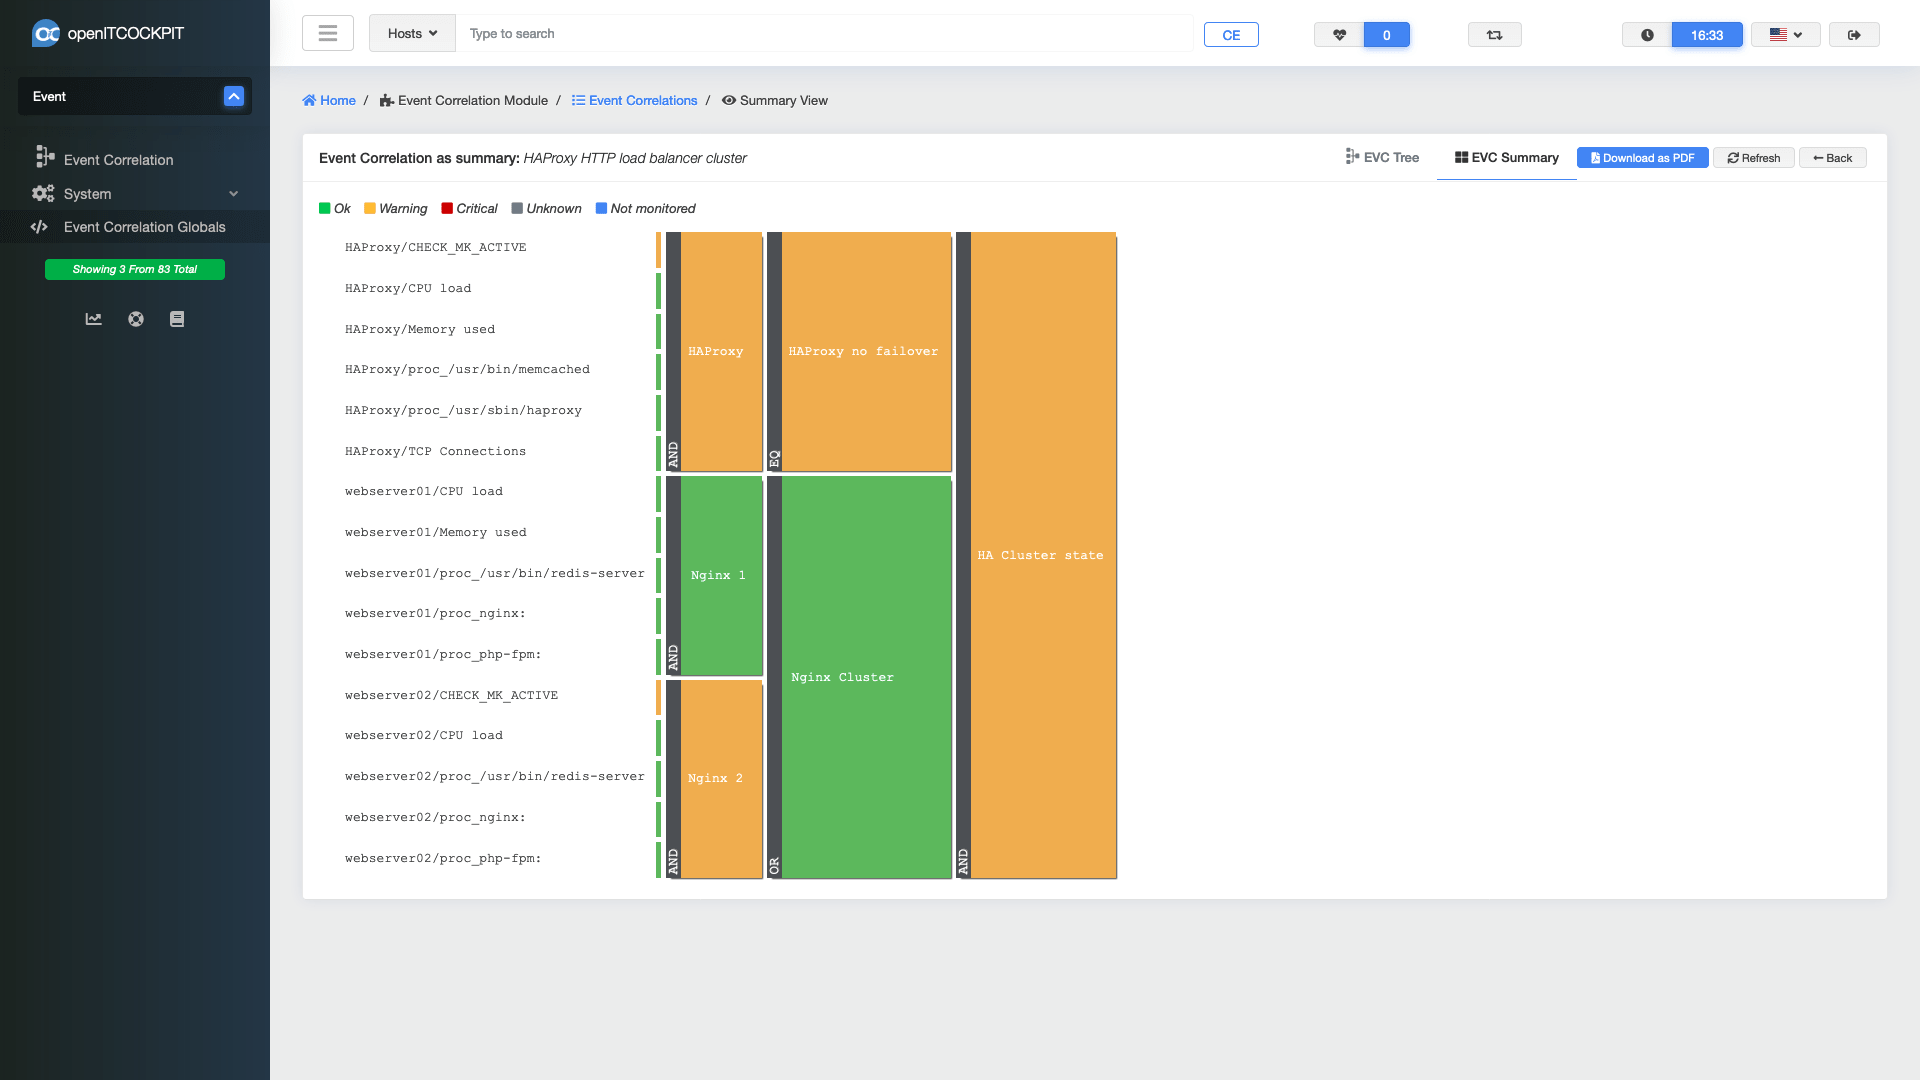
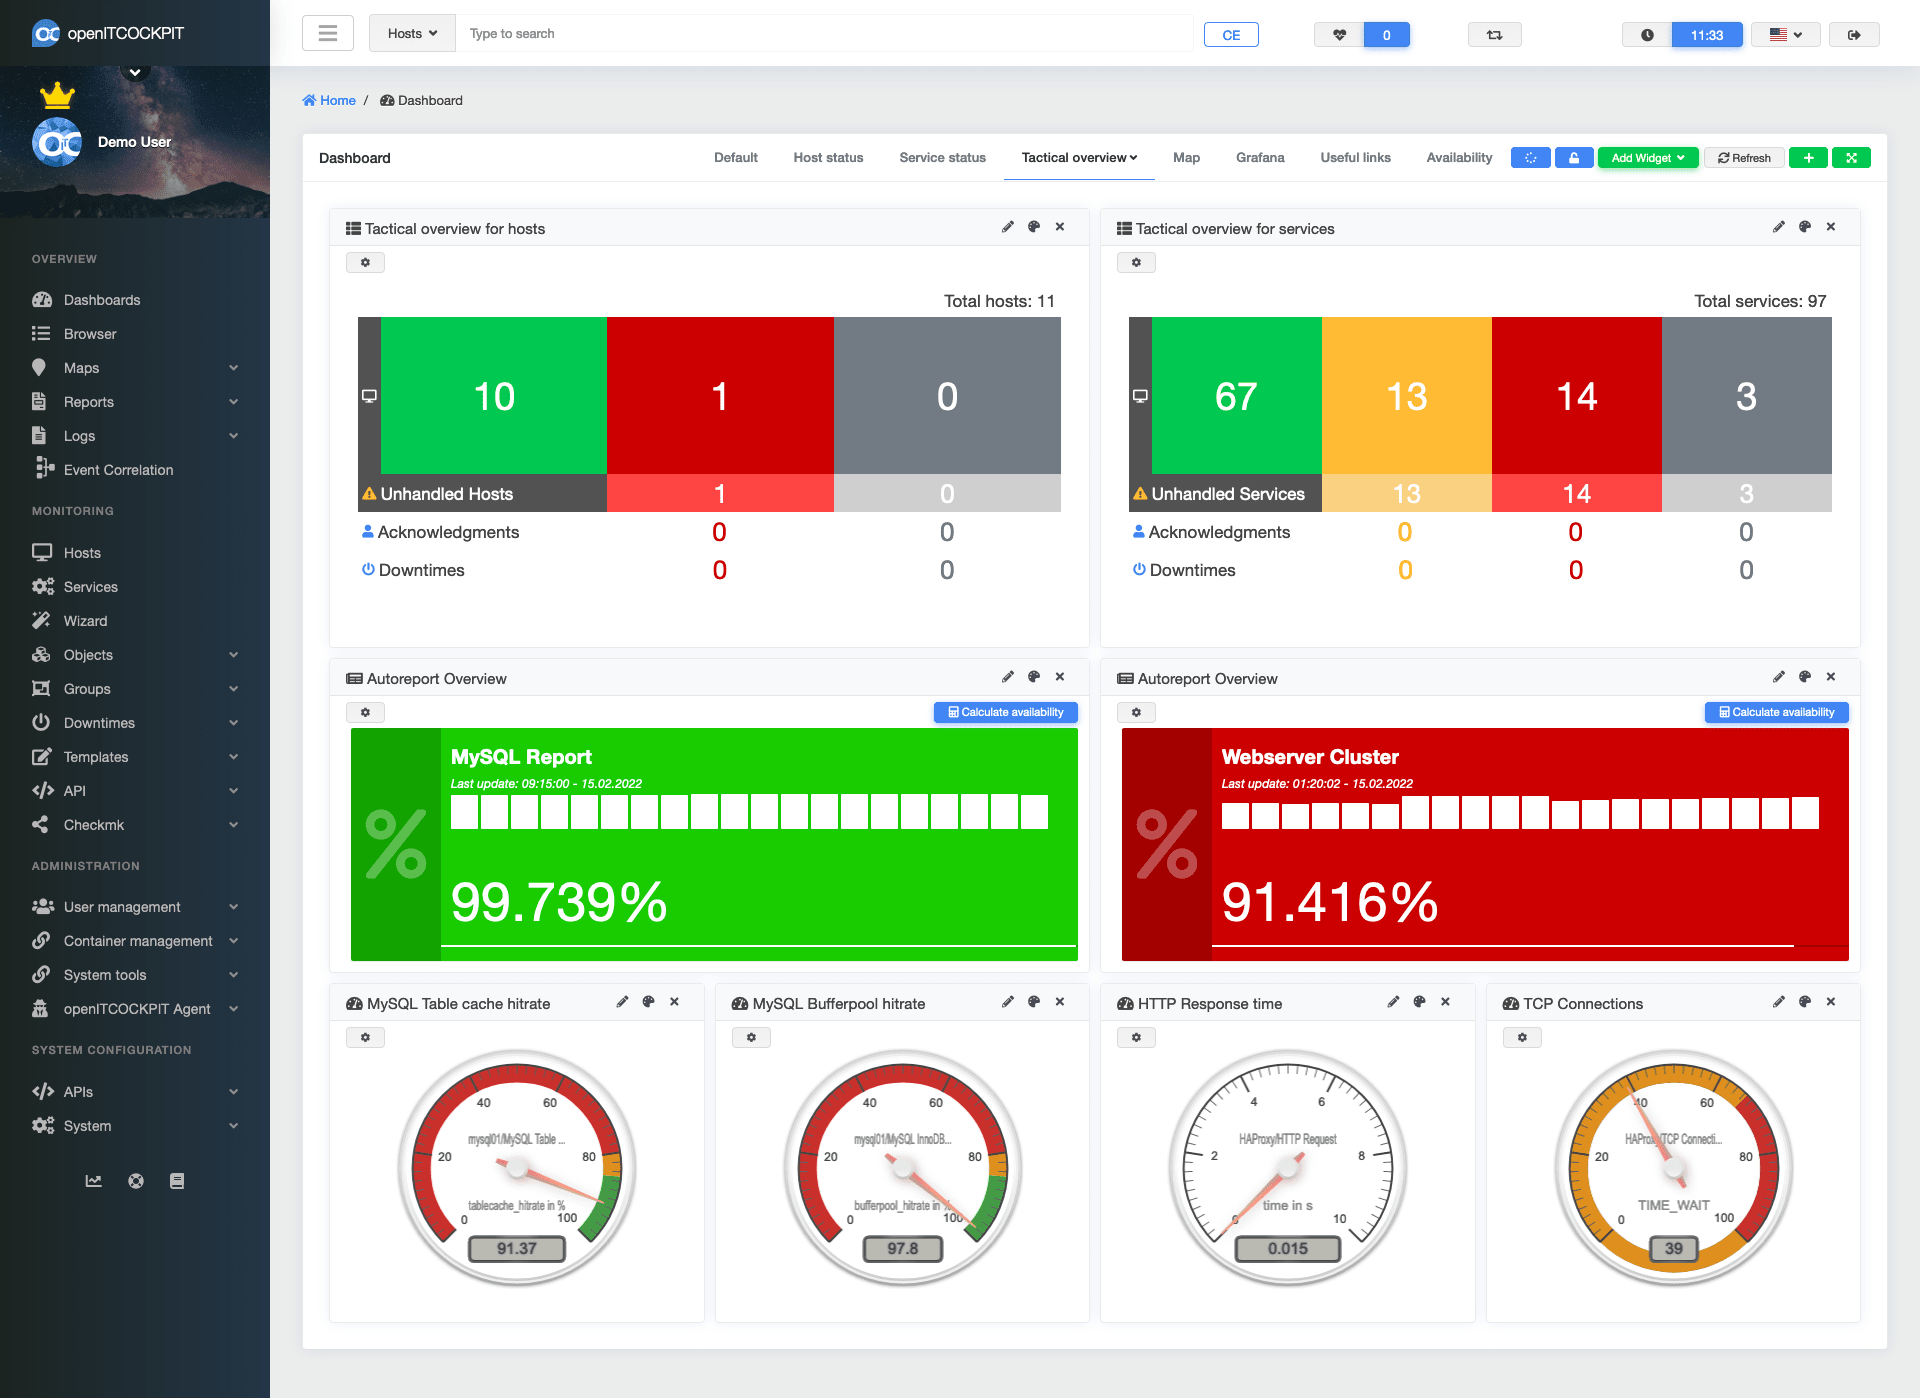
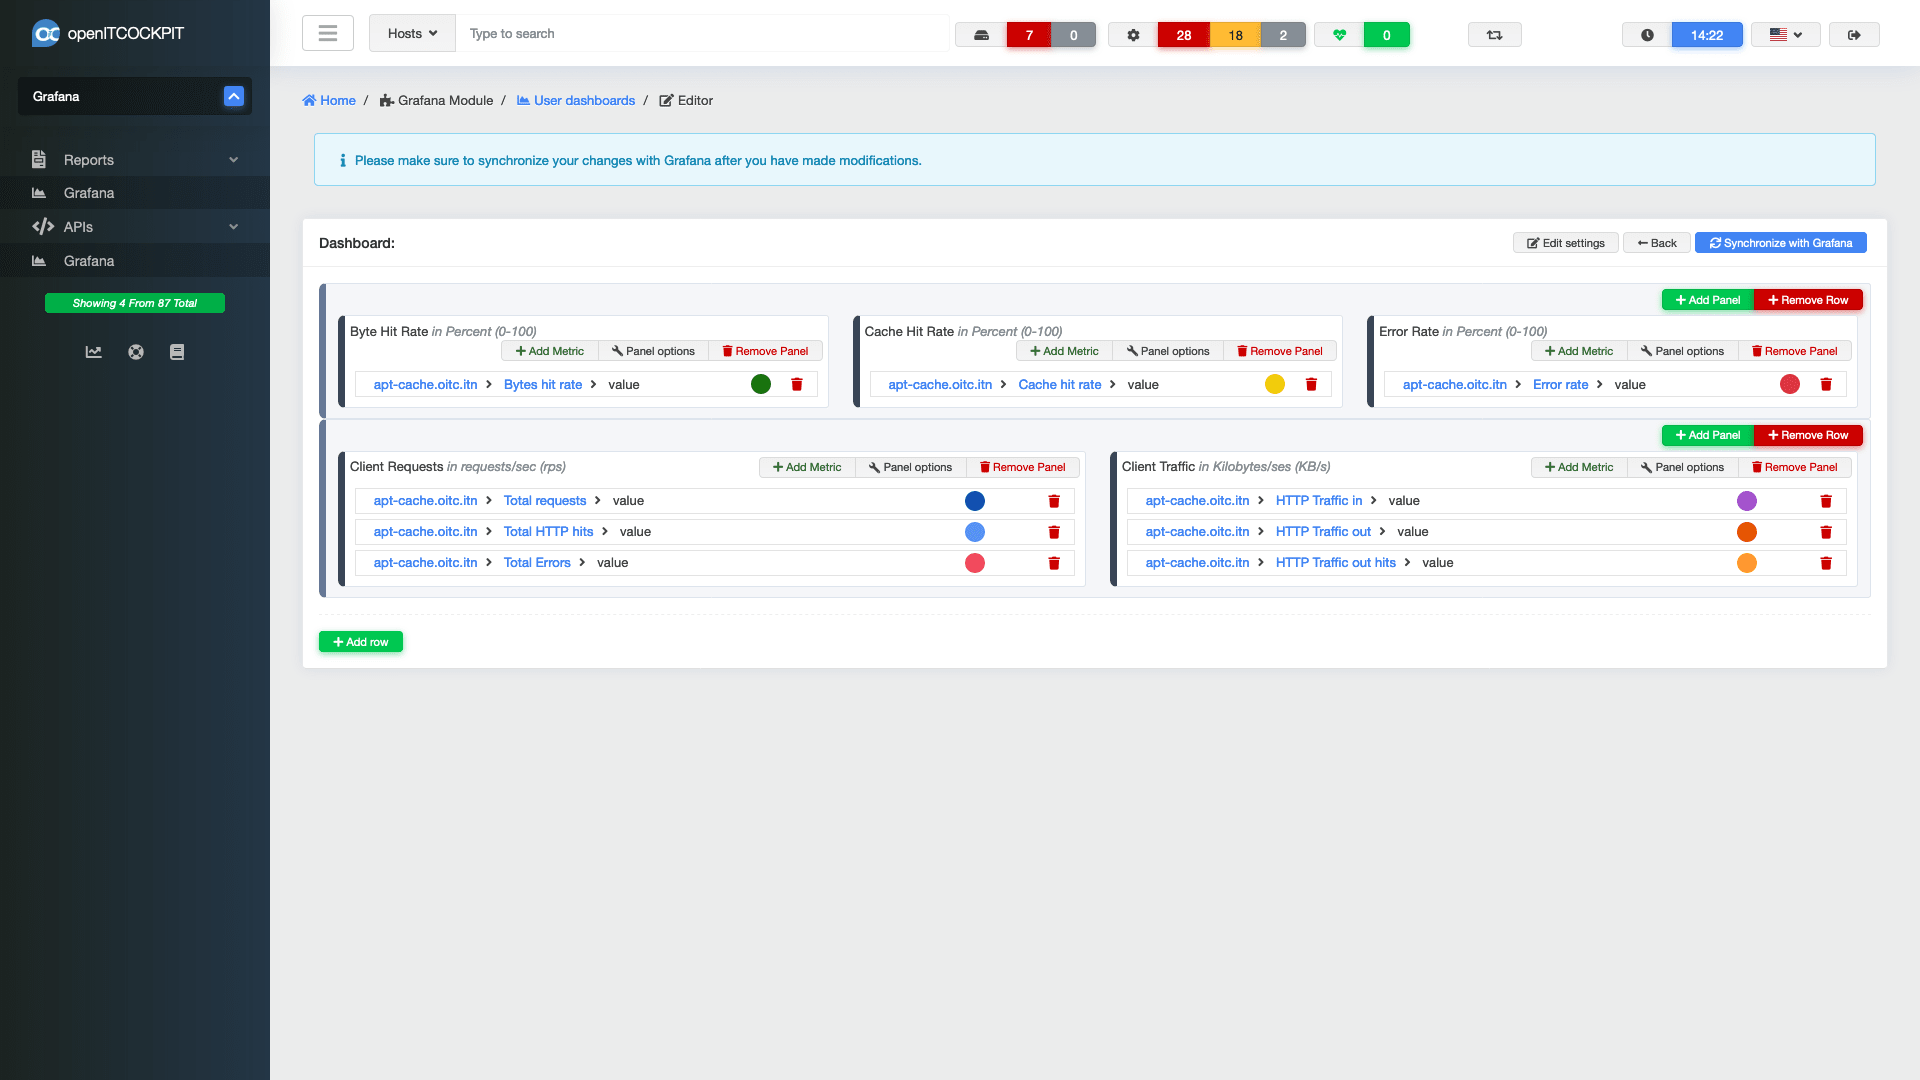
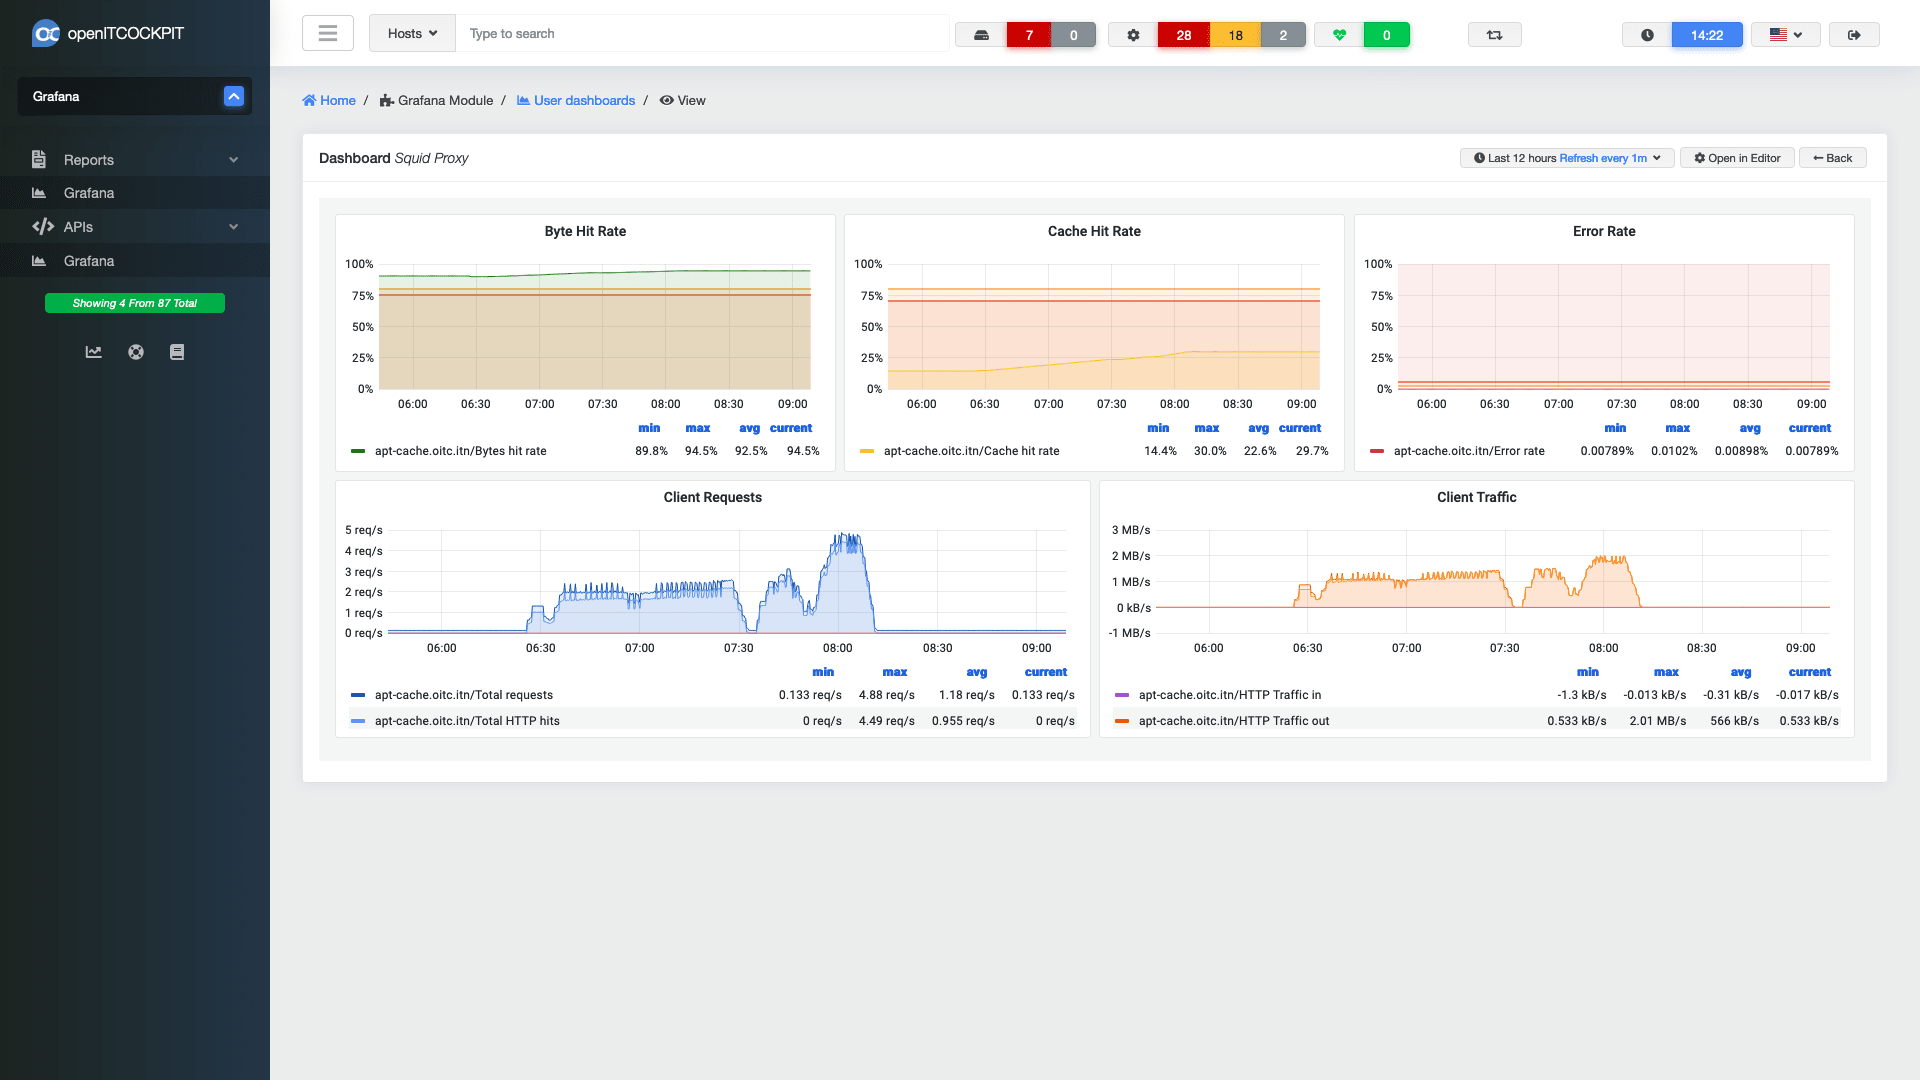
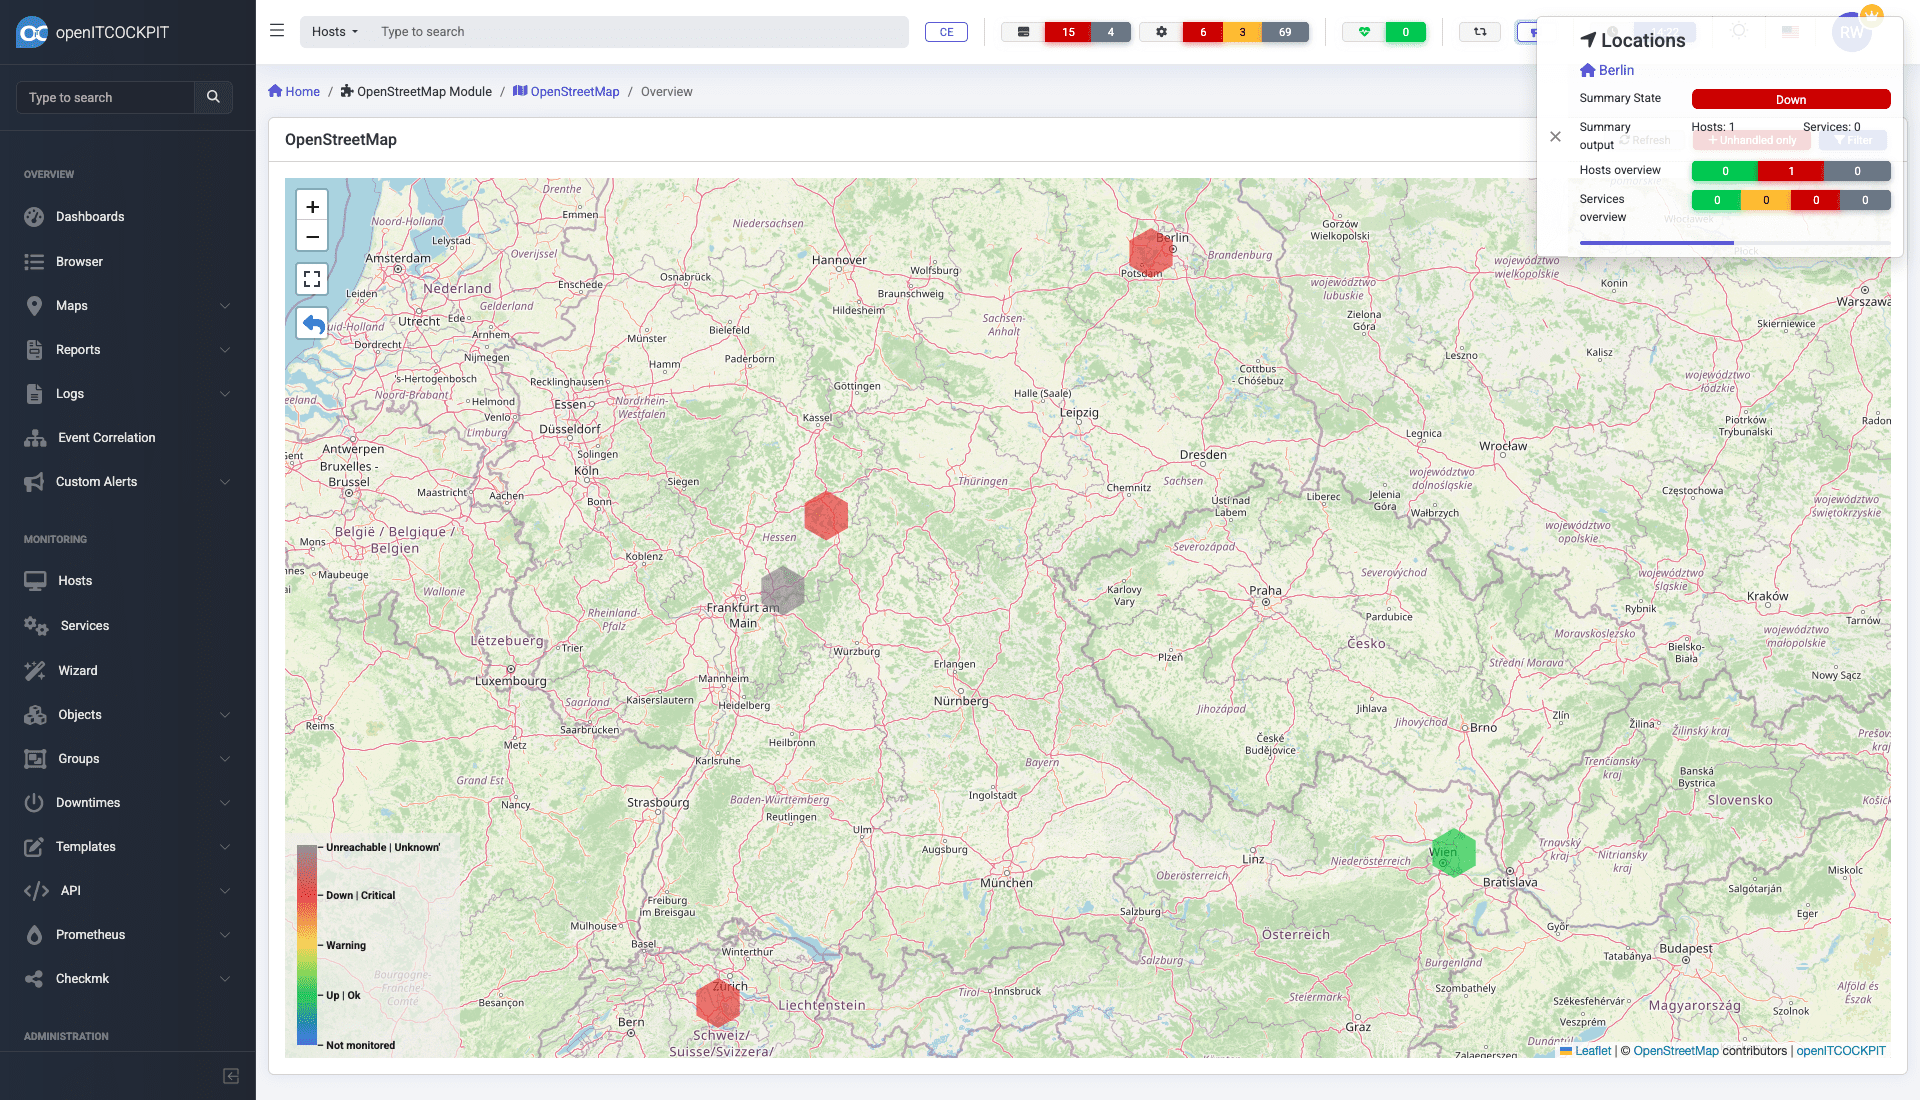
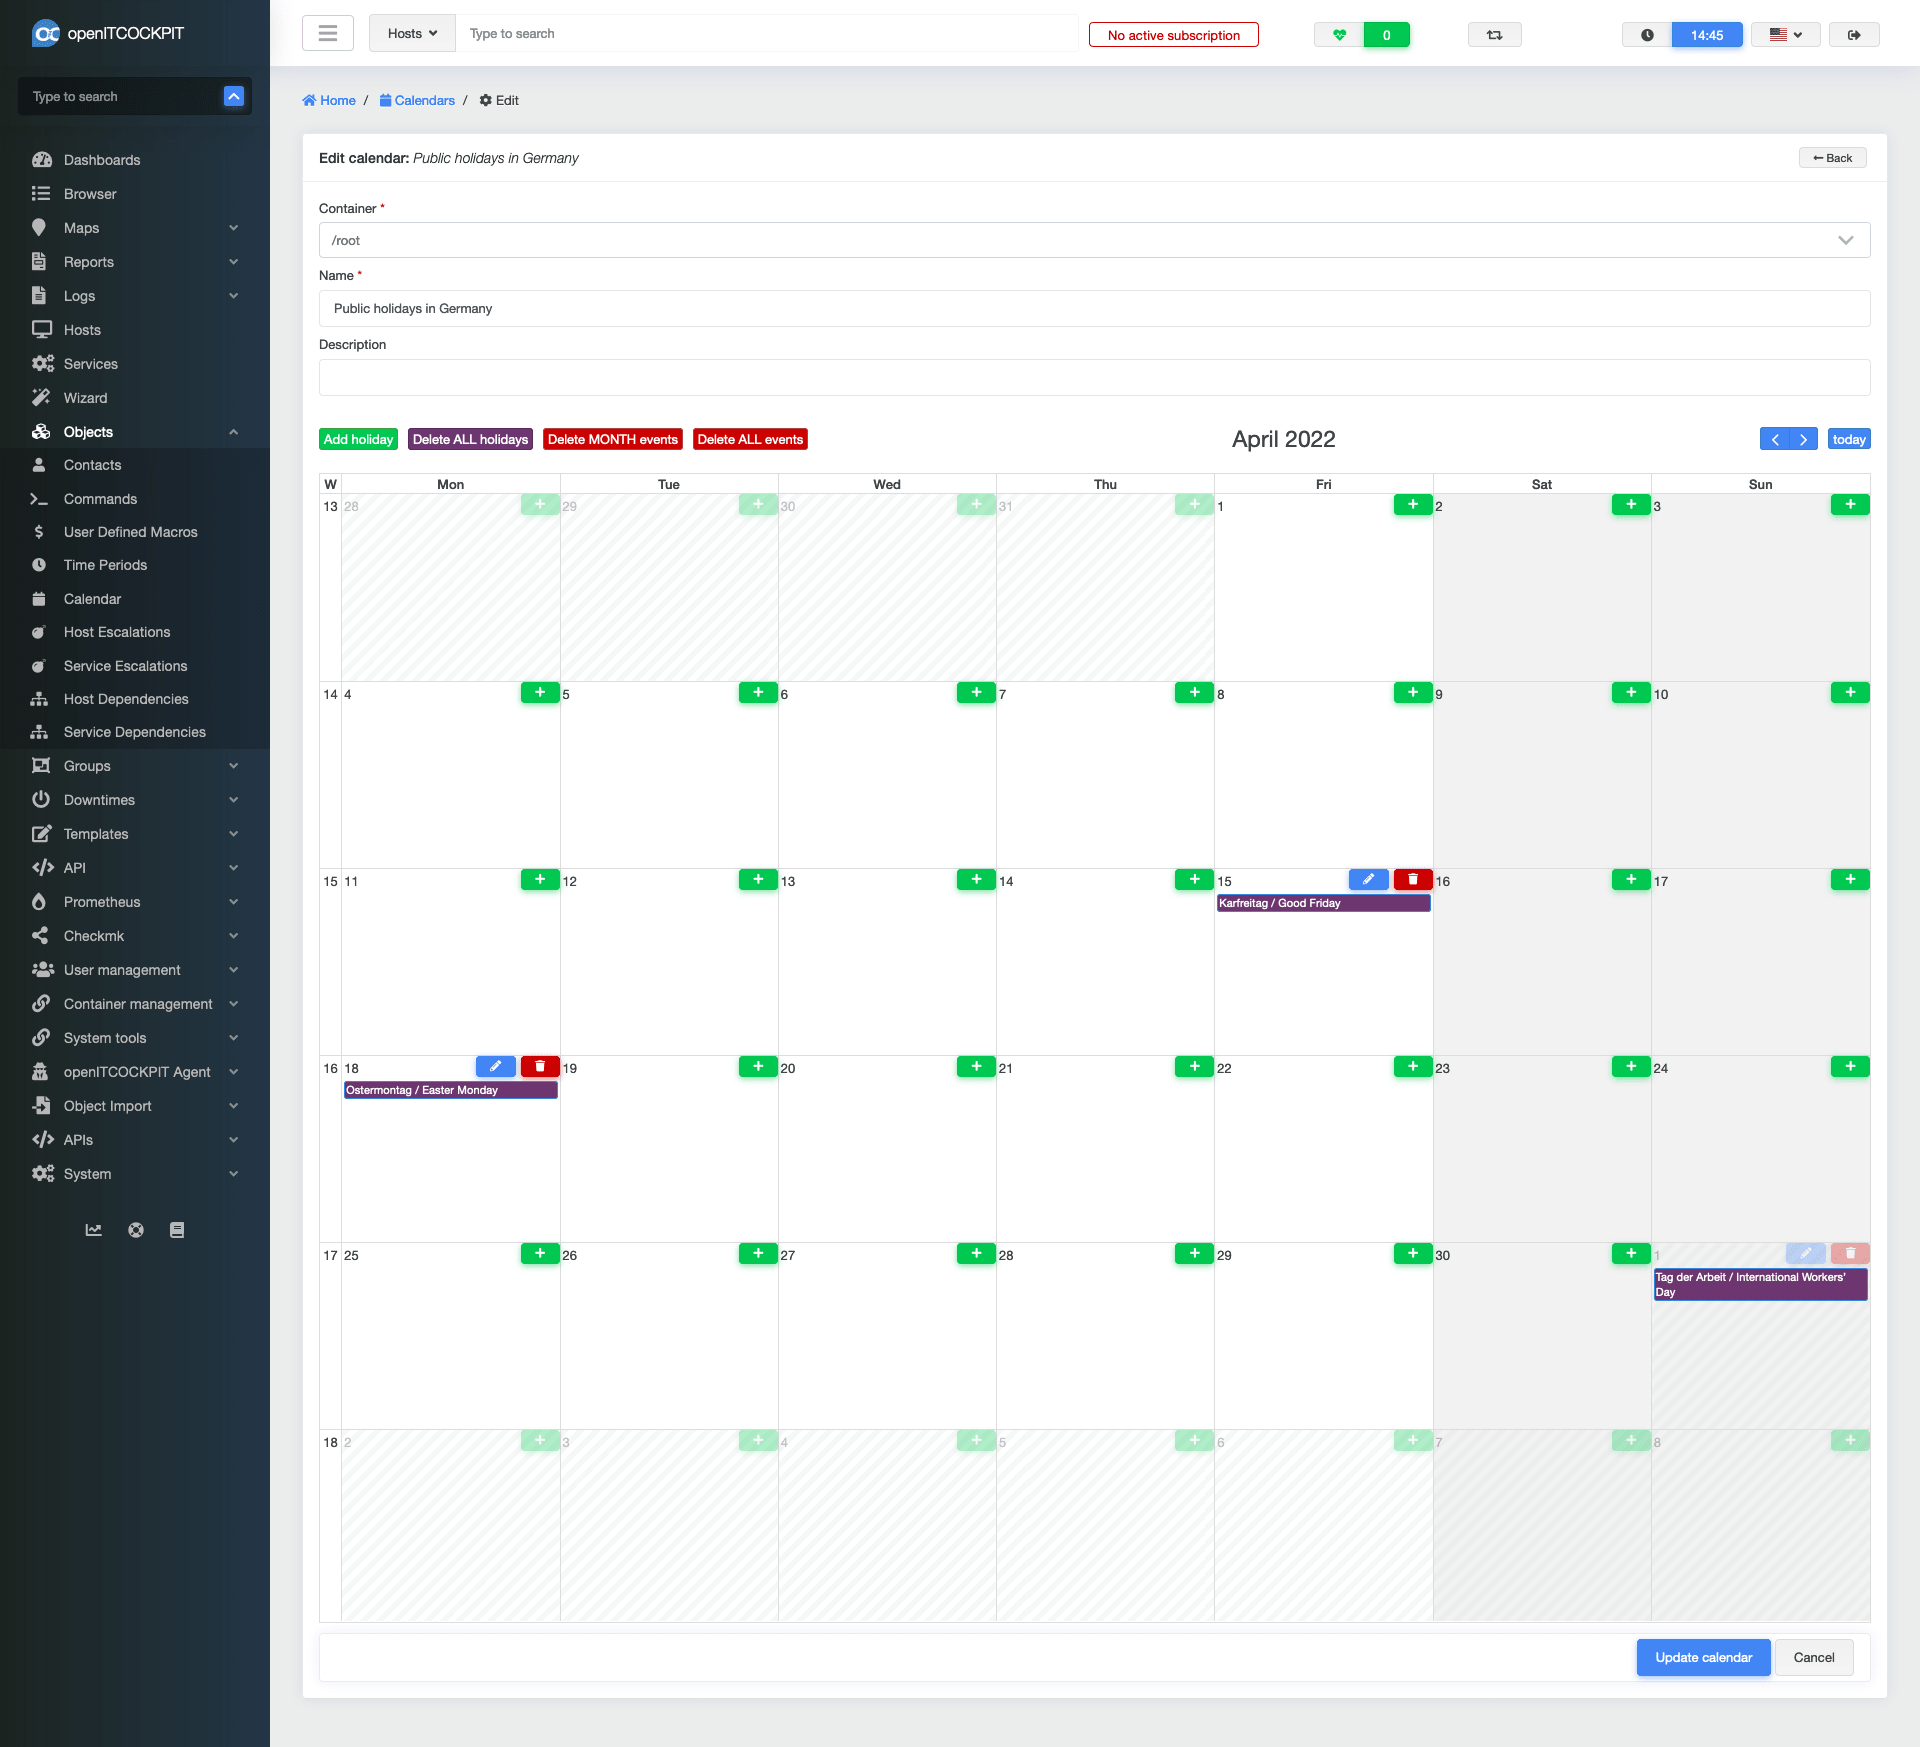
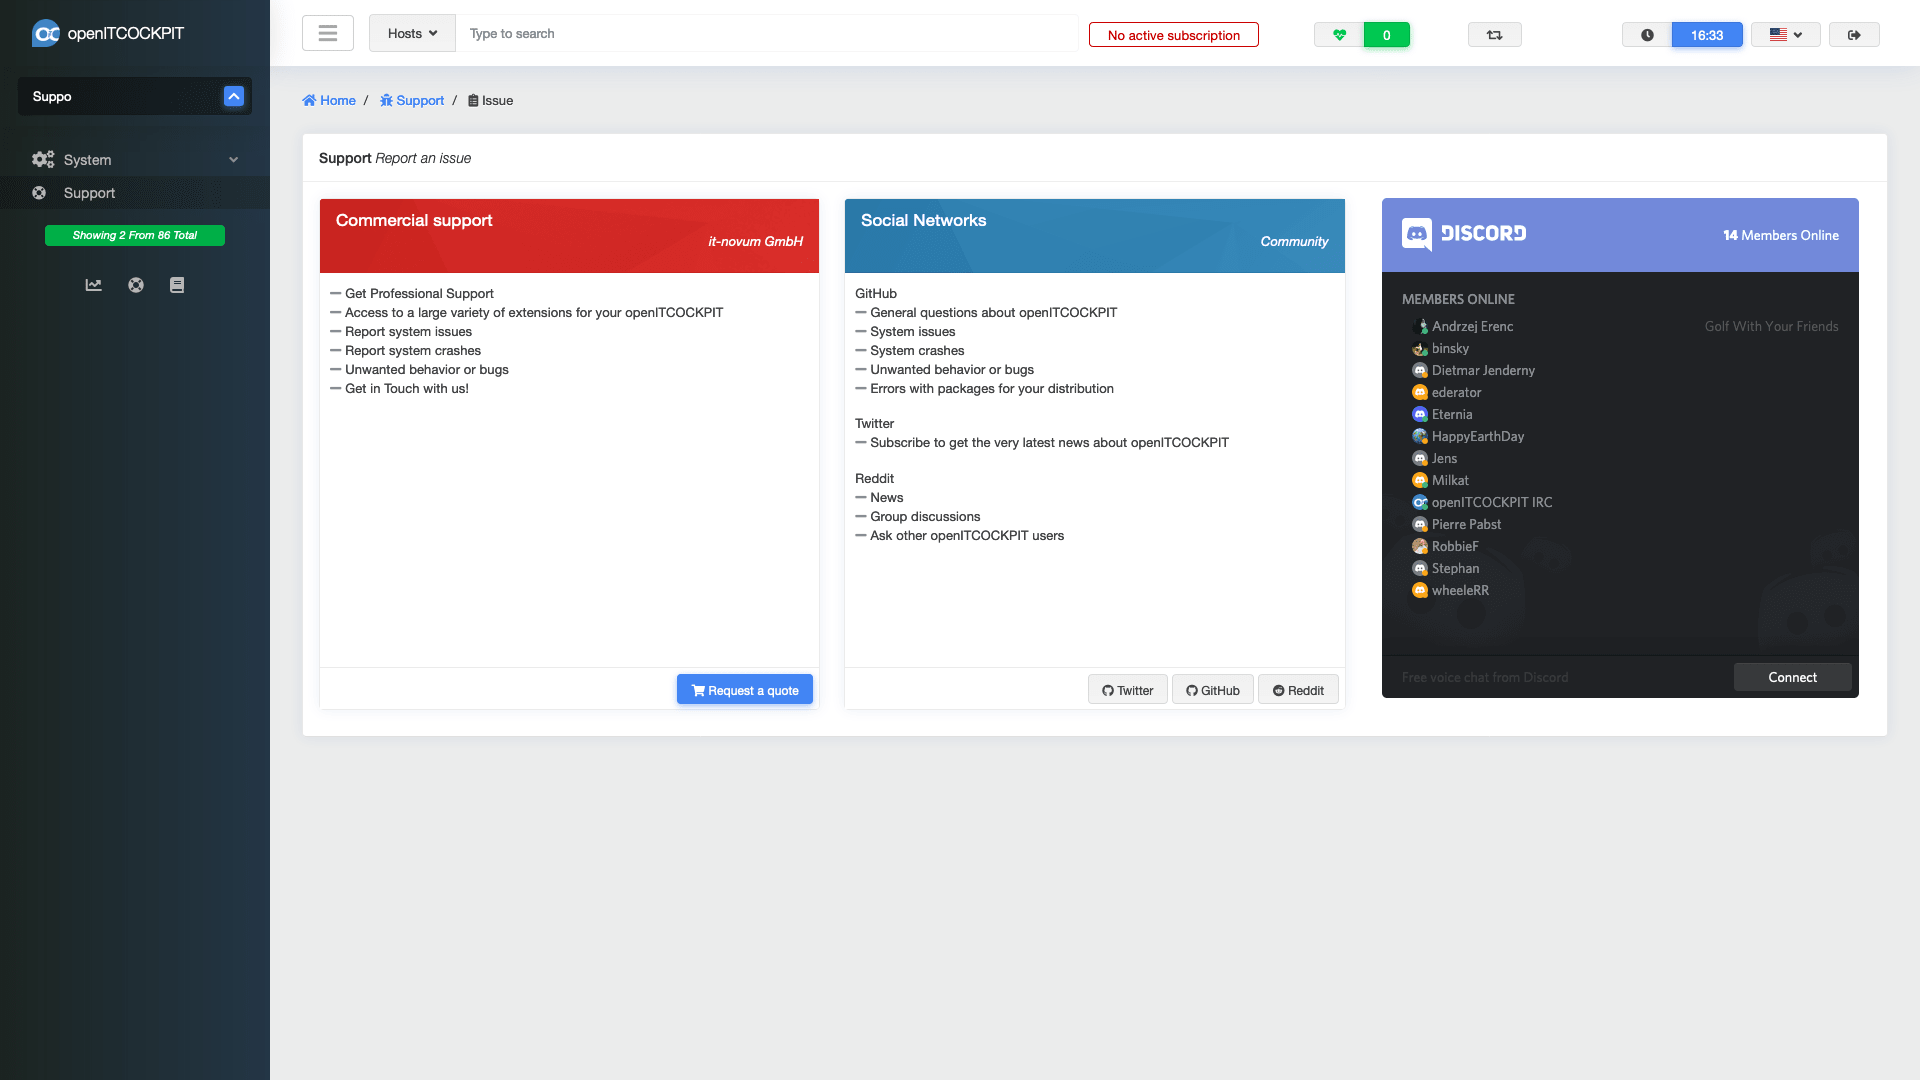
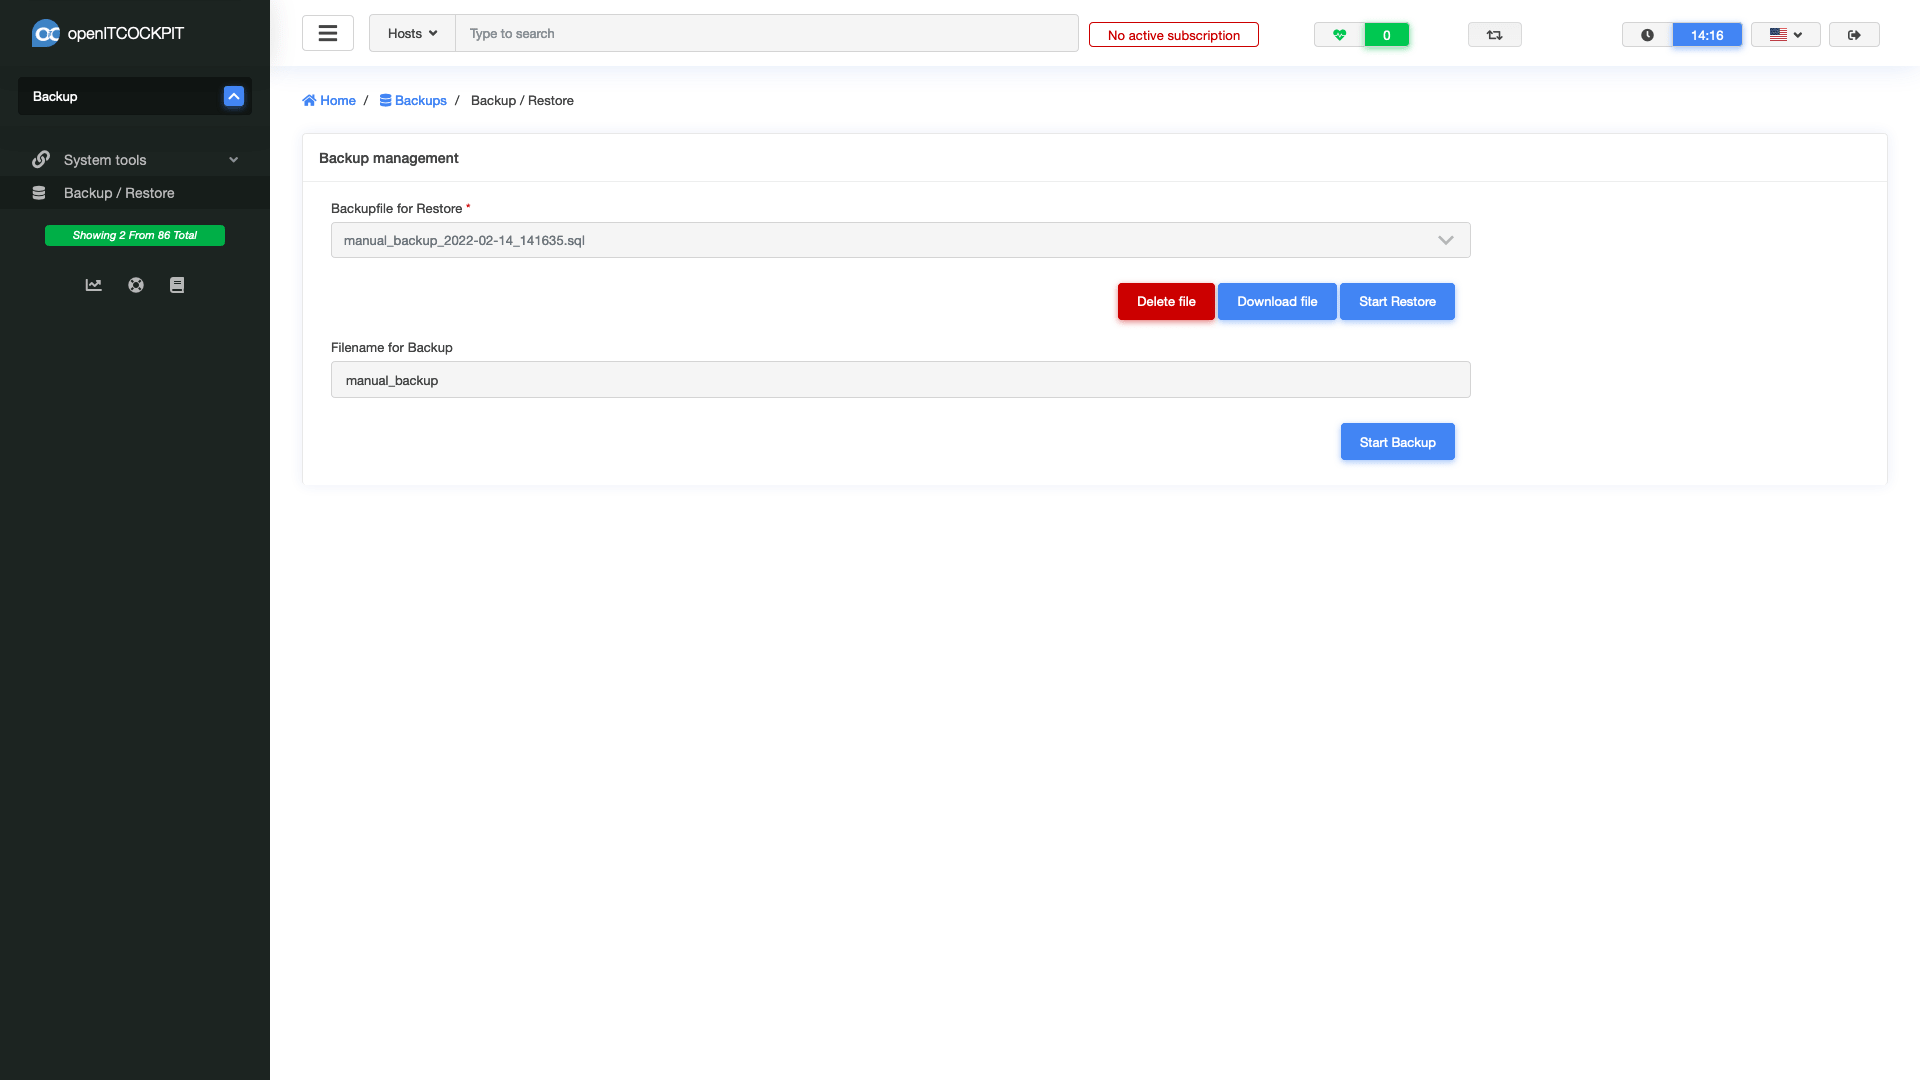
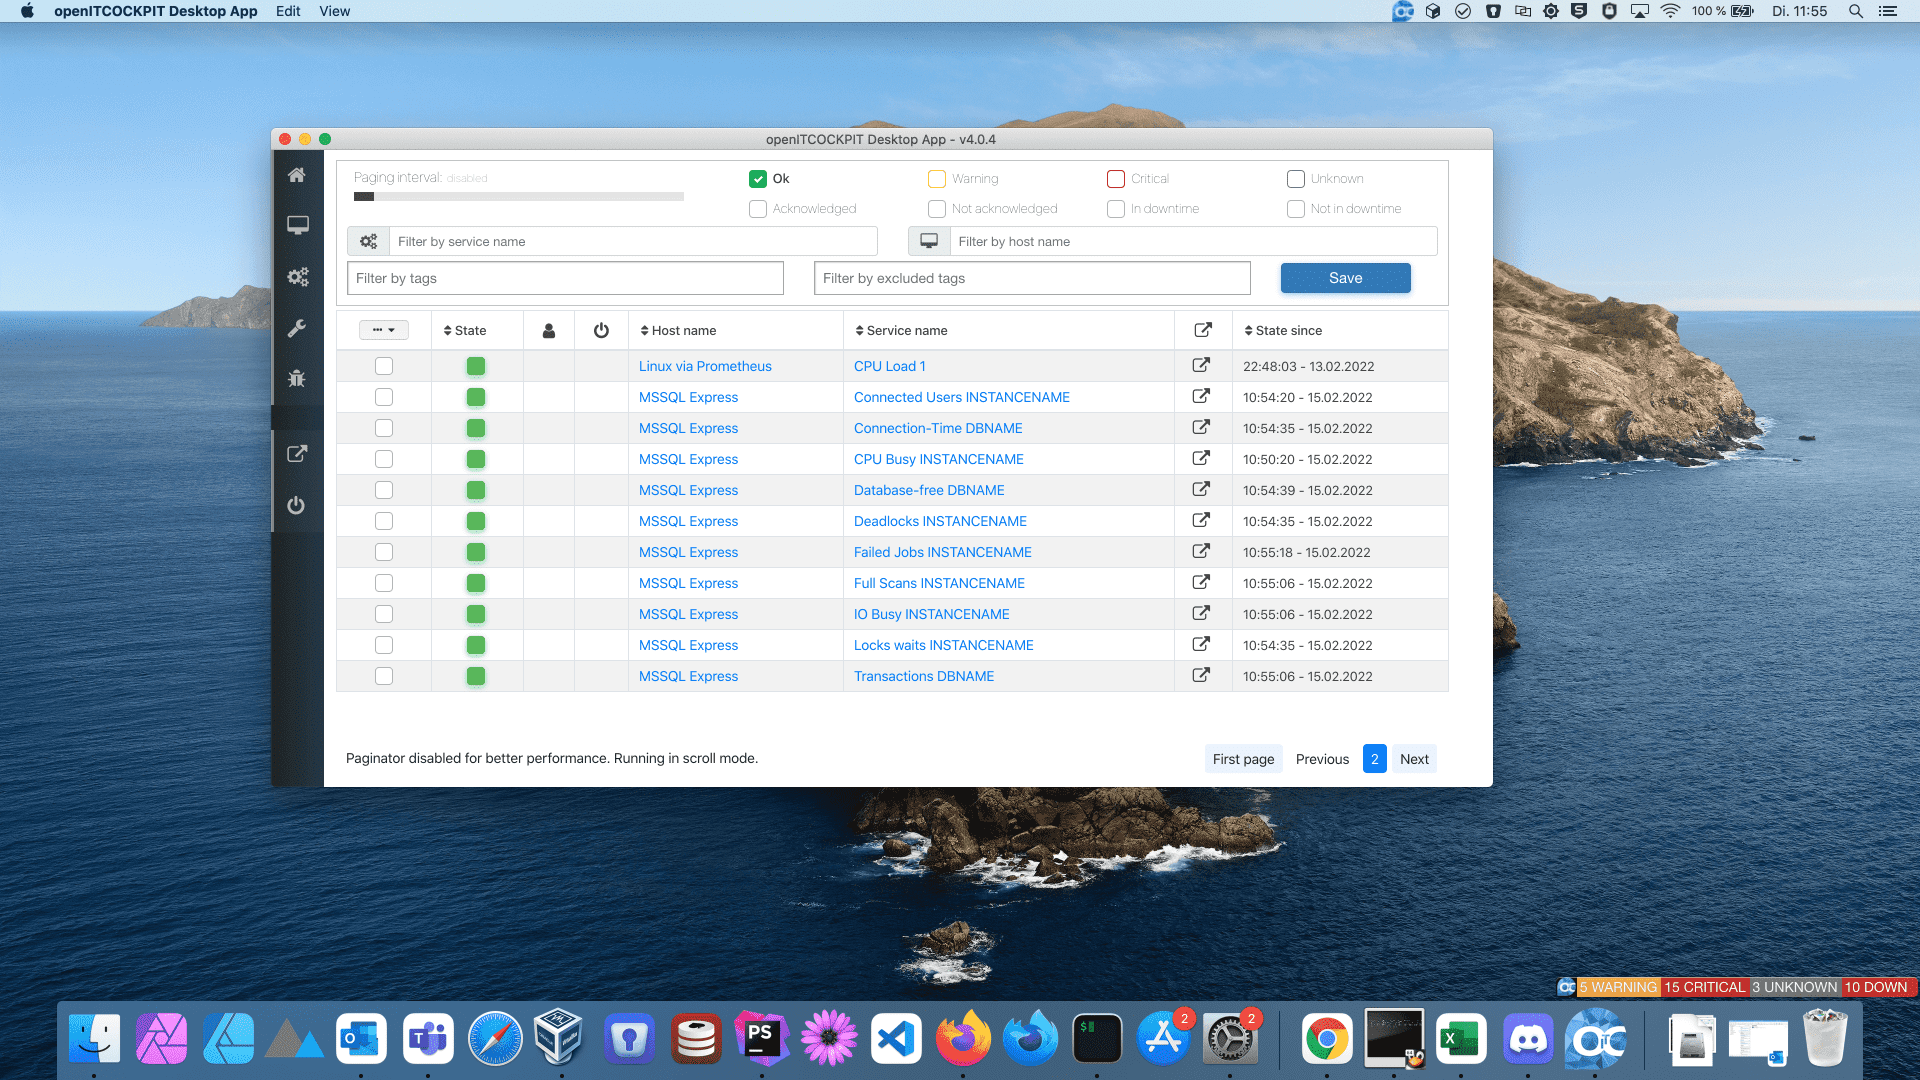
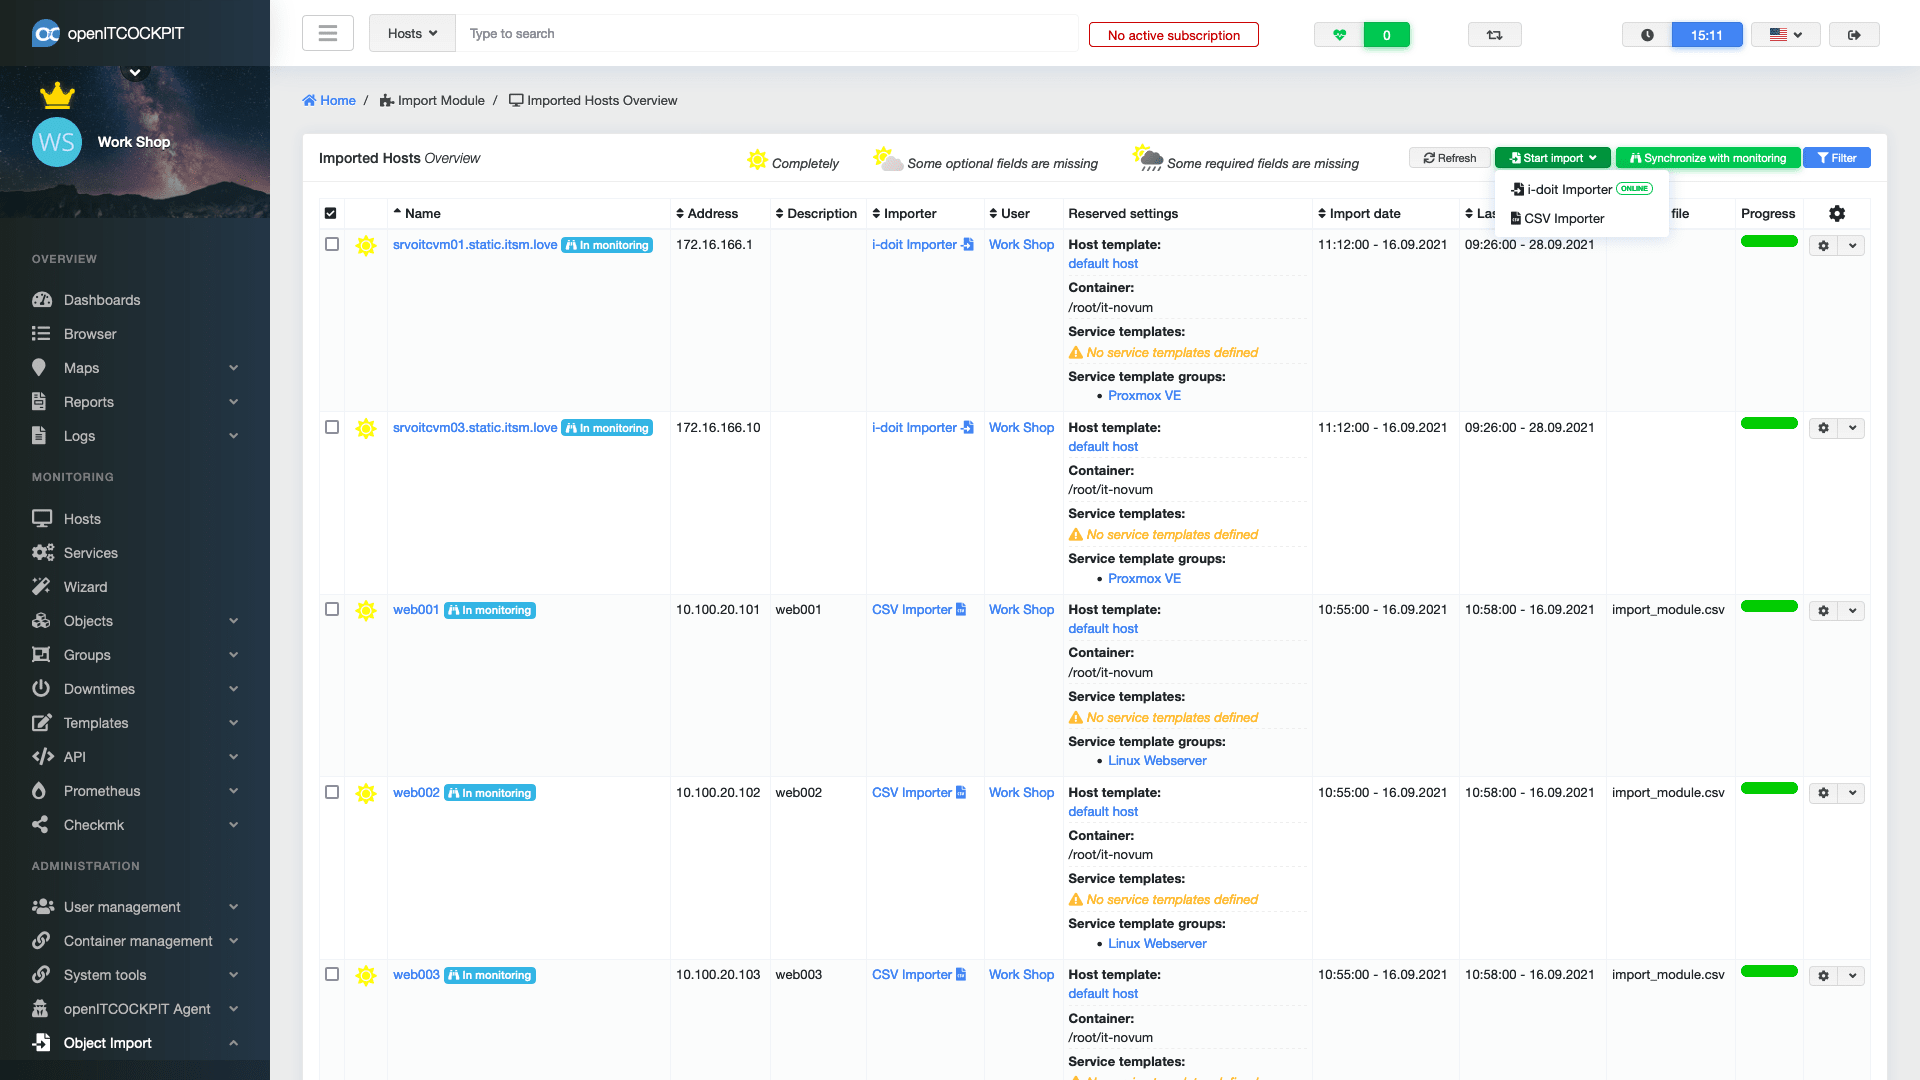
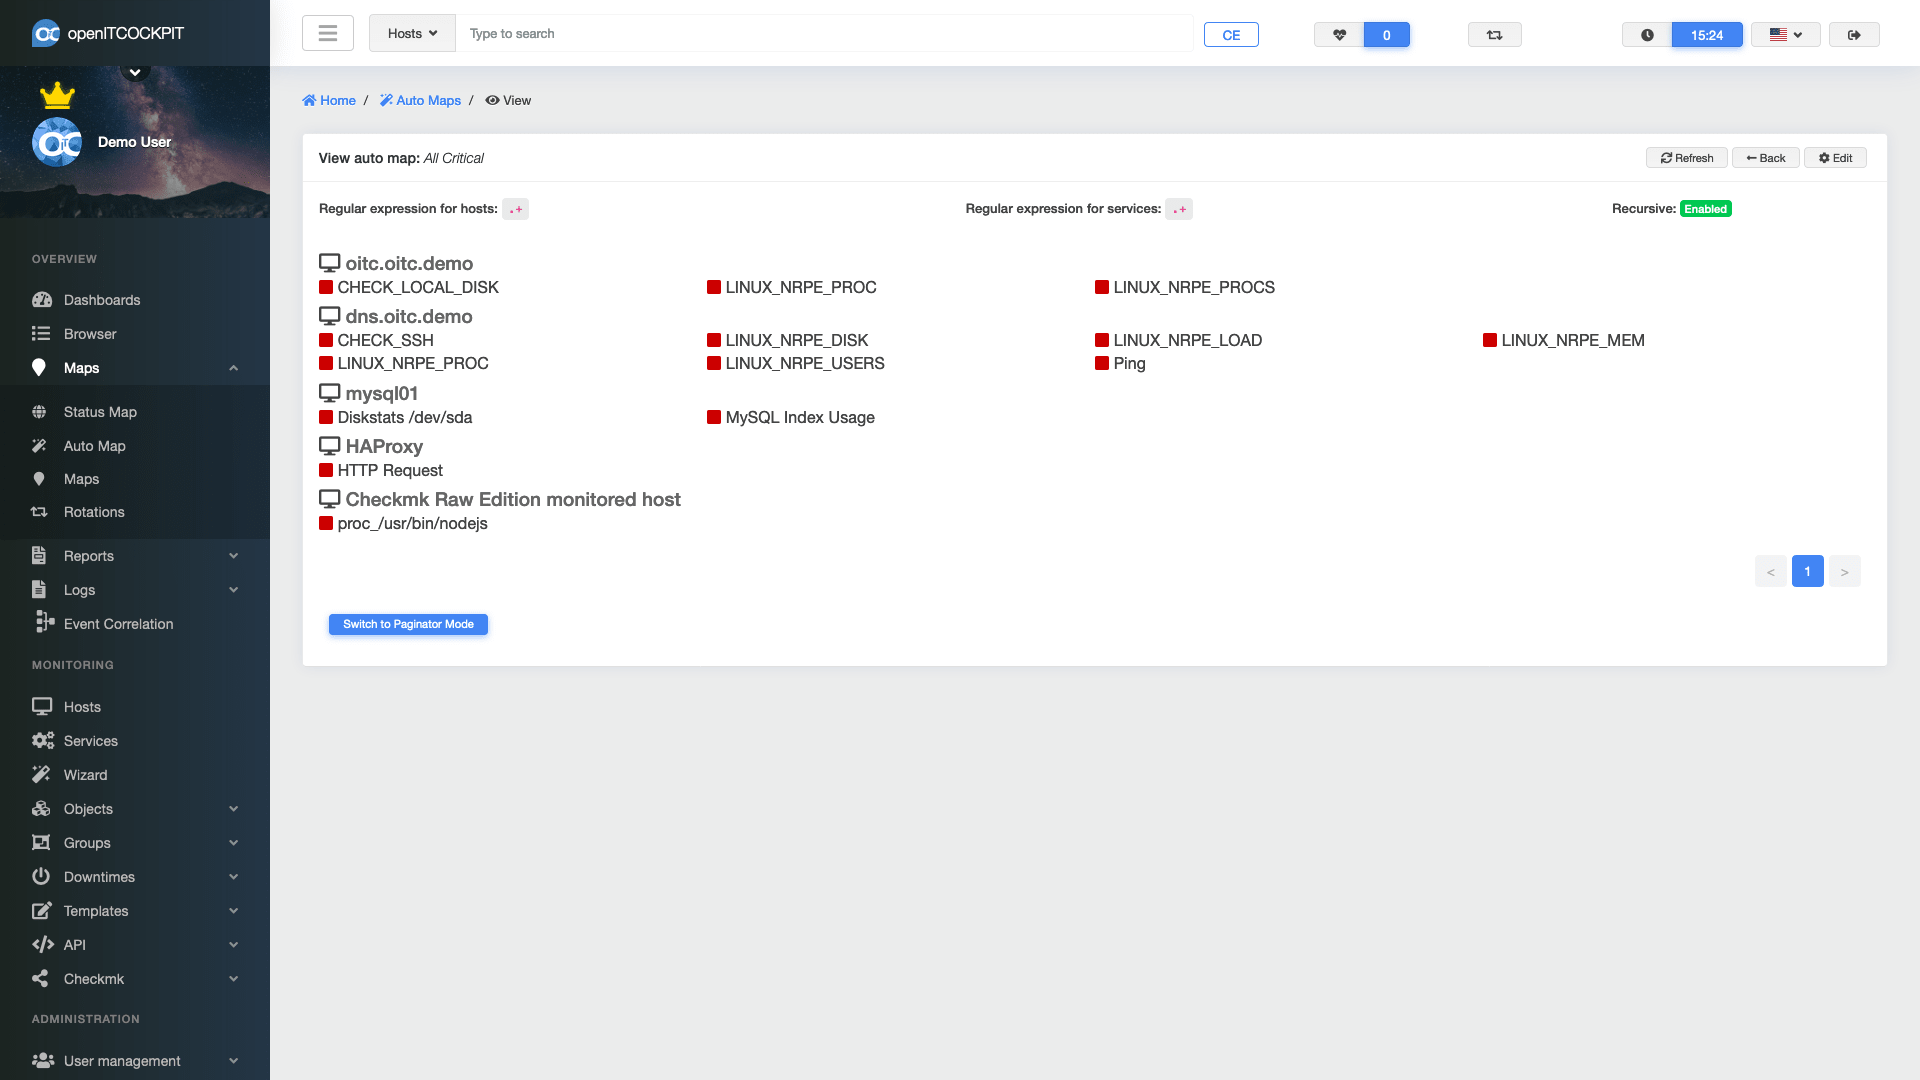
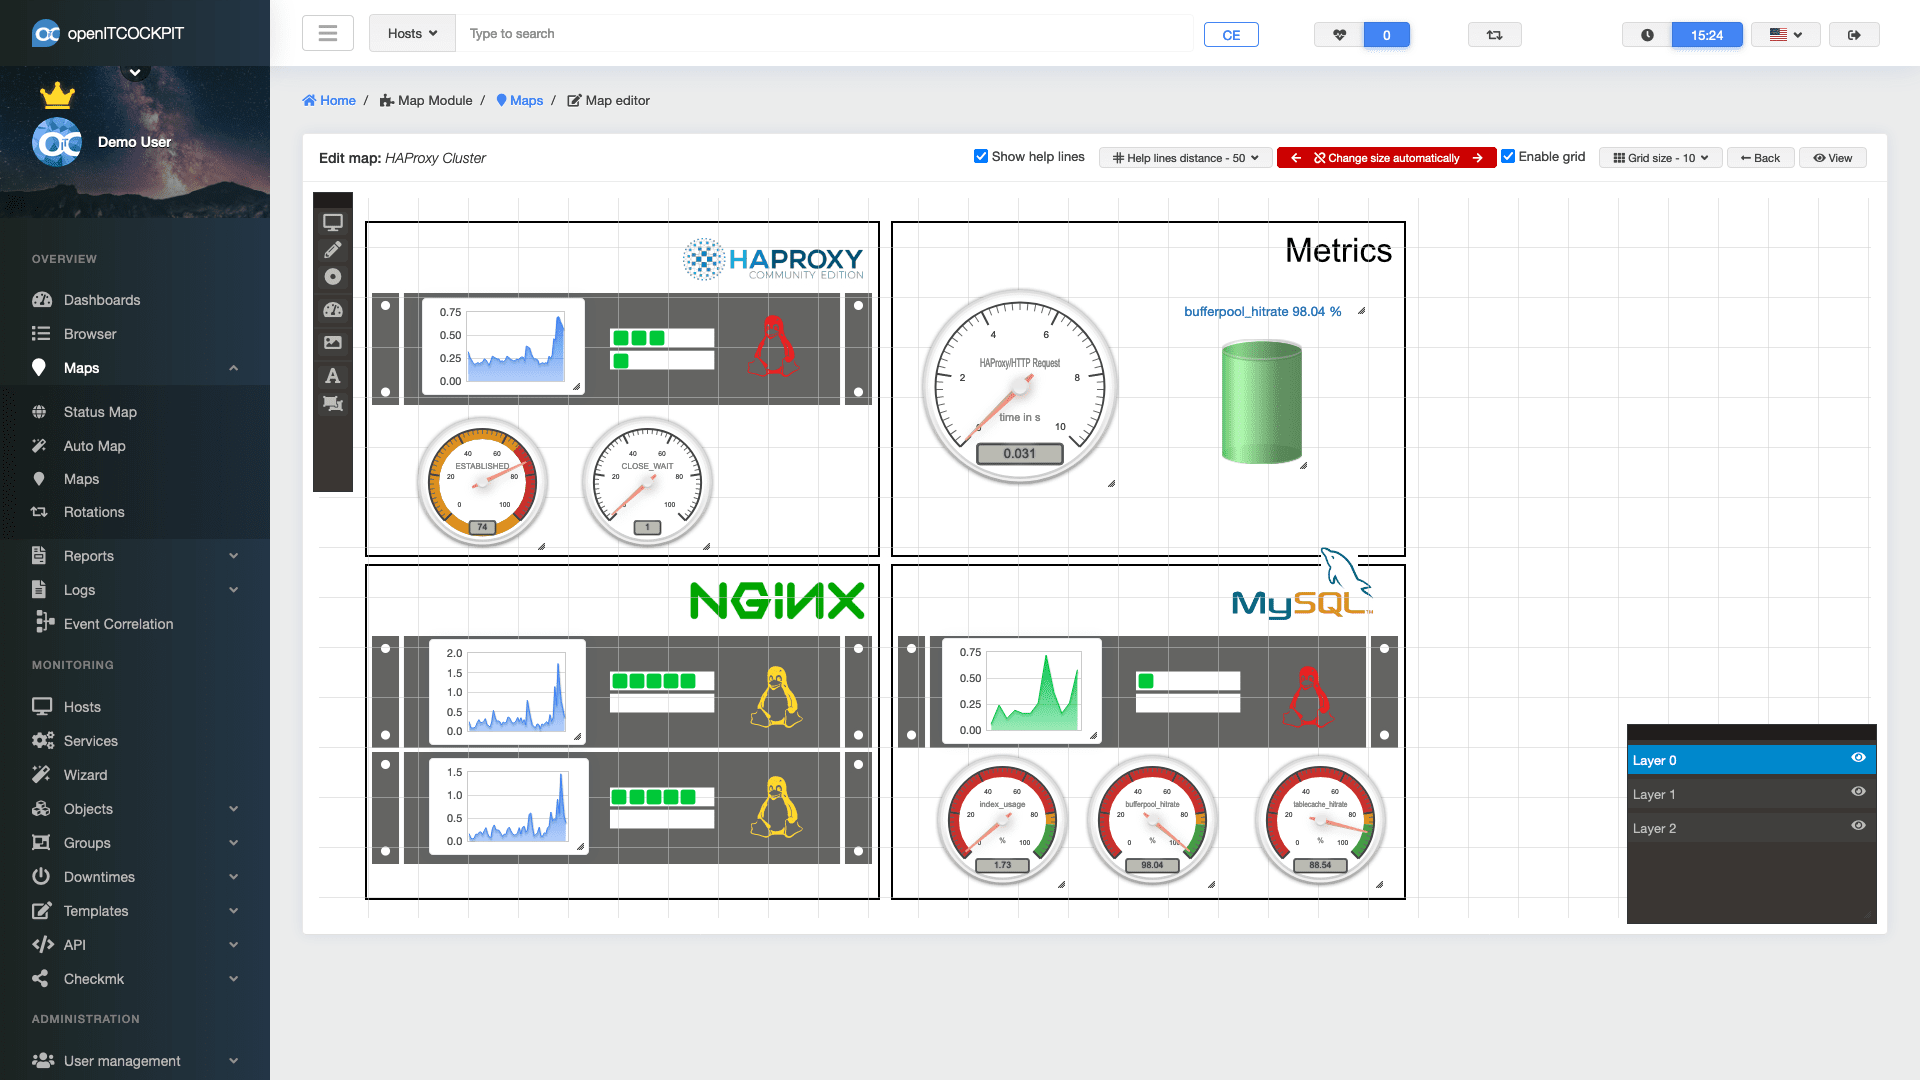
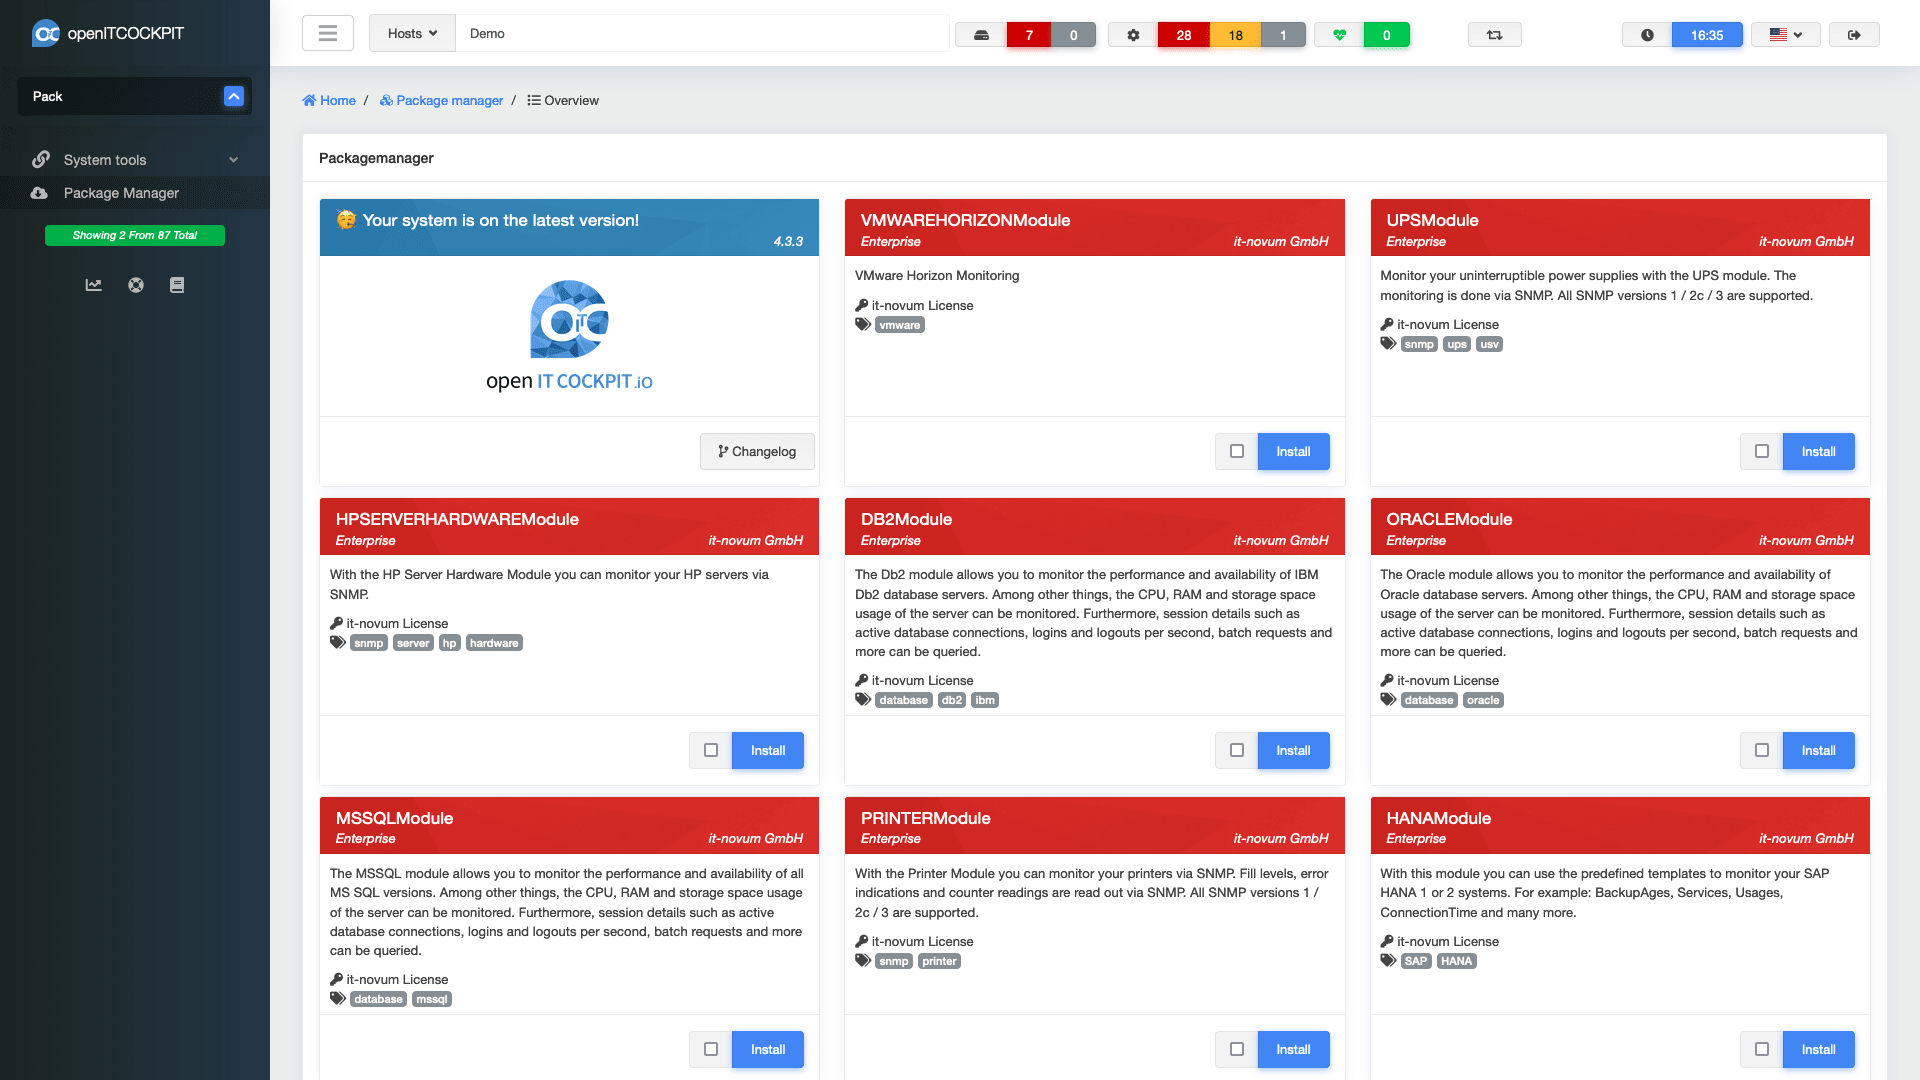
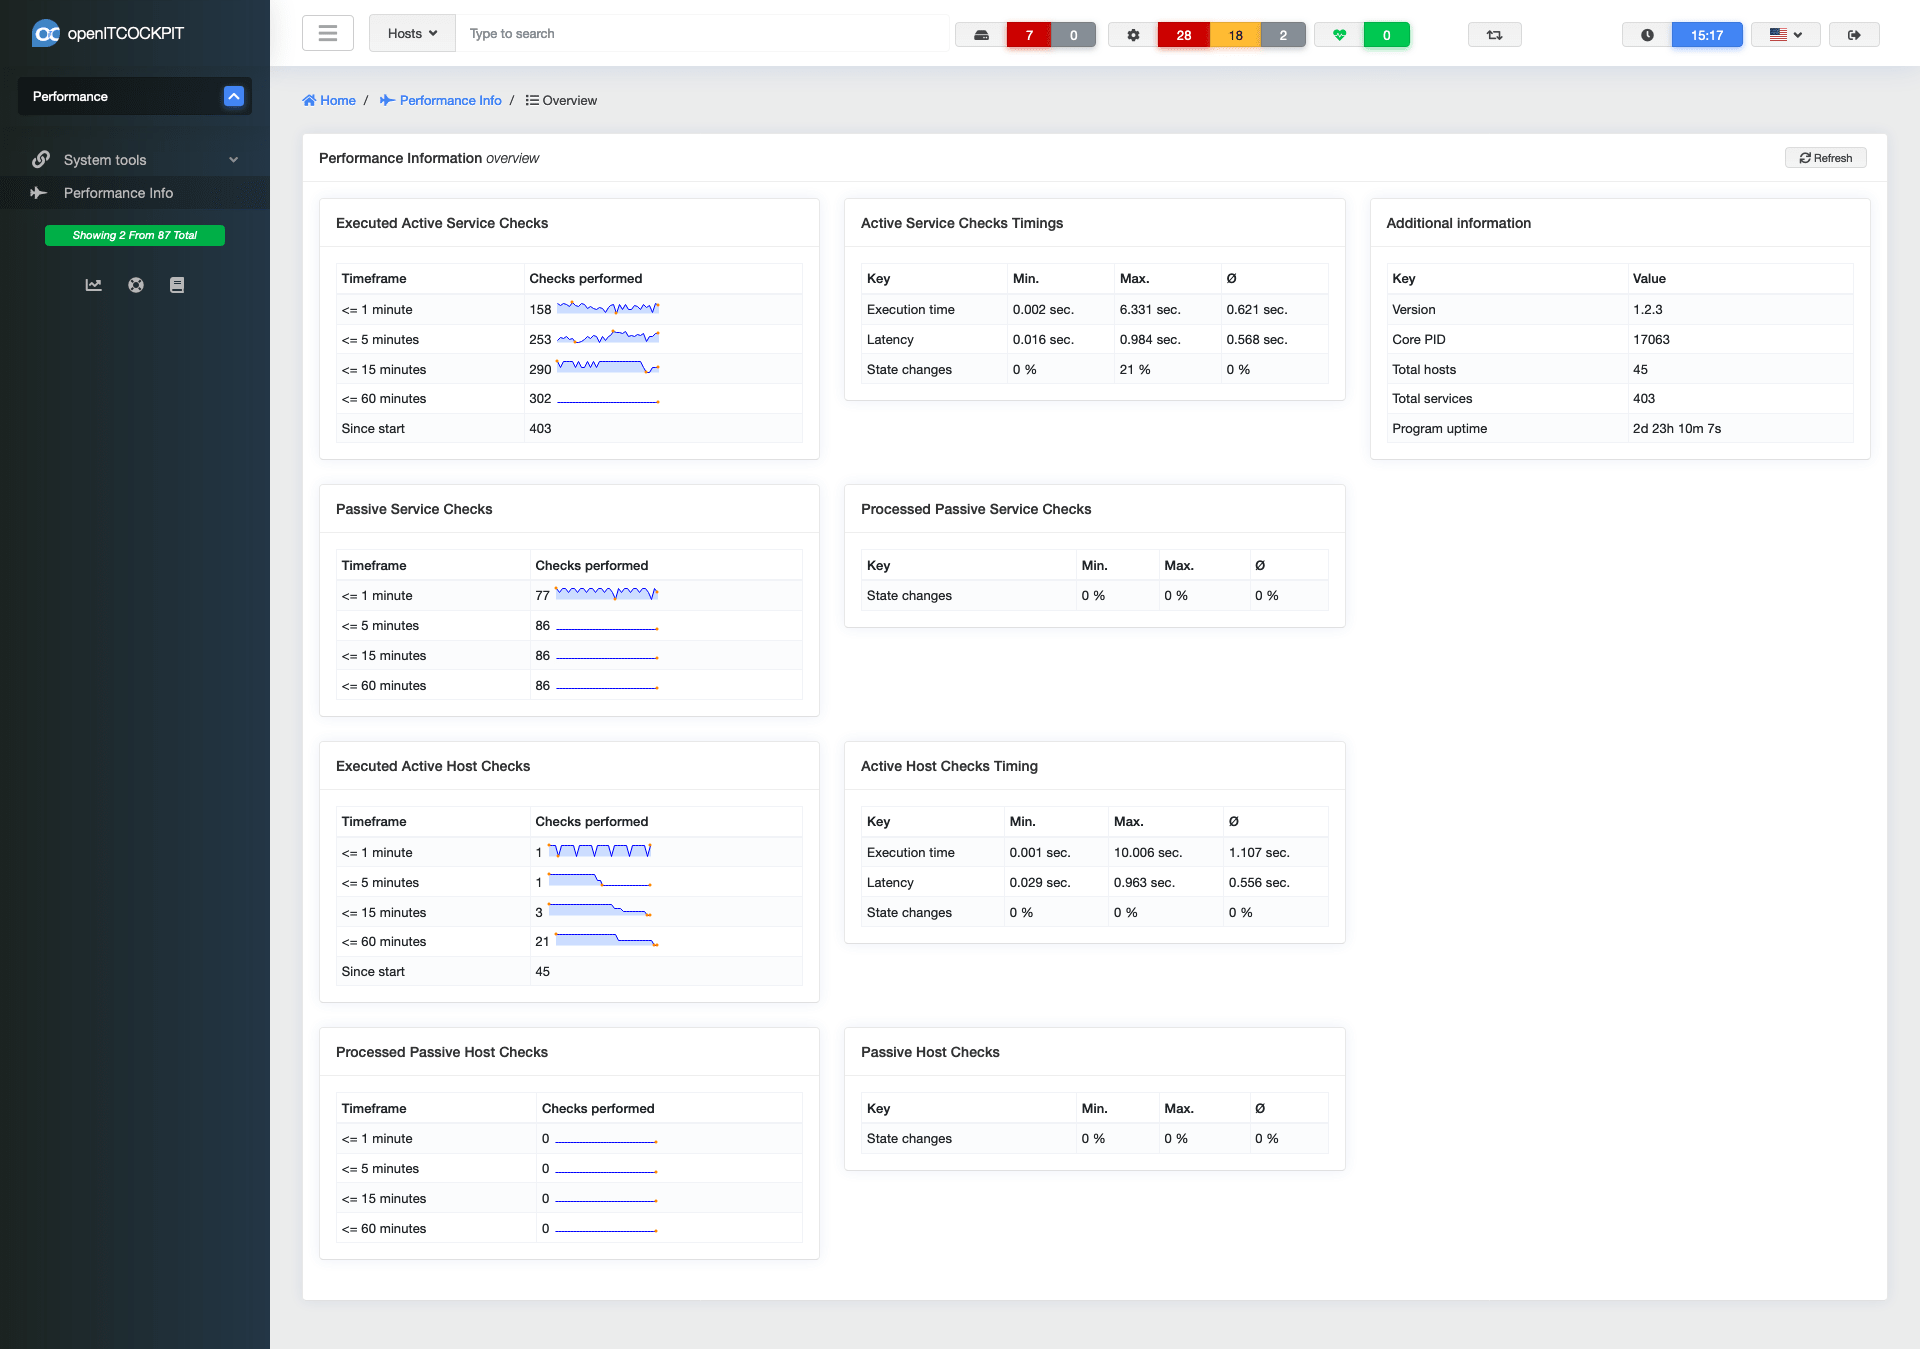
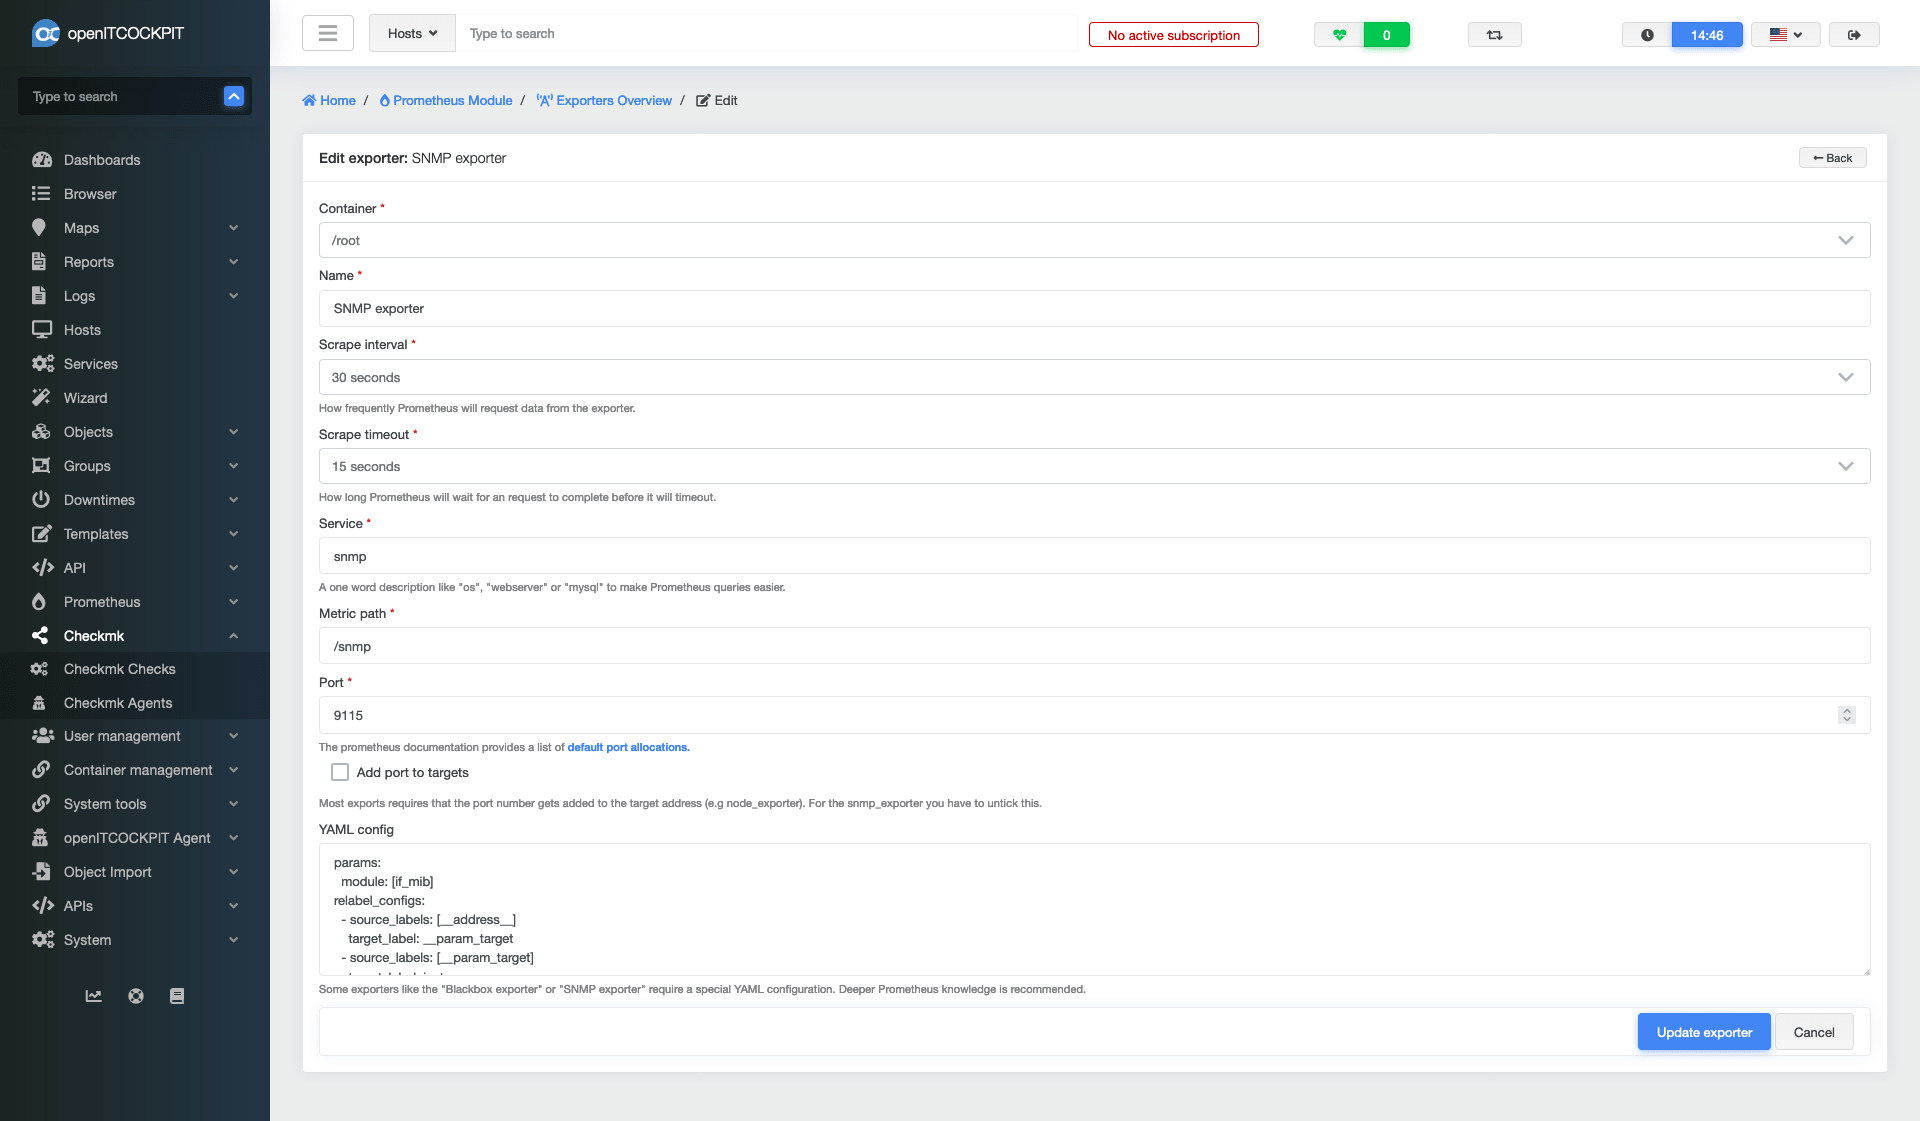
See openITCOCKPIT in action and take a look at our real world examples.

We recommend experiencing all the awesome features of openITCOCKPIT first hand using our demo system or scheduling a webcast.

openITCOCKPIT Community
Detailed information about a particular service
Predefined wizards will assist you to quickly set up a powerful monitoring for the most common applicatio ...
Monitoring of a Microsoft SQL Server using on of the included Wizards with openITCOCKPIT.
The openITCOCKPIT Monitoring Agent is using secure HTTPS by default and can operate in Pull or Push Mode.
Adjust the configuration of the openITCOCKPIT Monitoring Agent within a few clicks.
Select what you like to monitor. The openITCOCKPIT Monitoring Agent will automatically pick up basic serv ...
Monitor your SLAs with automatically generated reports in PDF, CSV or HTML format.
Navigate through your infrastructure using the Browser feature.
Create beautiful reports which represent the current state to be prepared for presentations and meetings.
Manage user based API keys for external applications.
HTTP API to submit check results and commands to the monitoring engine.
Track configuration changes thanks to the build-in change log.
Define new check commands via the openITCOCKPIT interface.
Modify system configuration files through the web interface.
The Event Correlation module lets you create and monitor business services.
Summary view of Event Correlations which is also included in E-Mails alerts.
Every user can customize his personal dashboard and even share it with his colleagues.
Create custom Grafana dashboards directly from openITCOCKPIT.
View Grafana dashboards, also available as Widget for your custom dashboard.
Keep an eye on the global status with the OpenStreetMap module. Depending on the zoom level, the map will ...
openITCOCKPIT has pre-defined and customizable calendars which can be considered by reports or to suppres ...
Do you have a question? Commercial and Community Support is available.
Backups of the openITCOCKPIT database can be created and restored from the openITCOCKPIT interface.
The openITCOCKPIT Desktop App is available for Windows, macOS and Linux.
Change the colors and logos used by openITCOCKPIT within a few clicks. No programming required! Of course ...
Automatically import hosts and deploy services from different data sources such as CMDBs, CSV files or th ...
Automatically generated maps filter by regular expressions.
Visualize your infrastructure with the Map Module. Place icons, charts tachos and more with a WYSIWYG edi ...
Browse through all existing module for openITCOCKPIT and extend the monitoring ability.
Monitoring the monitoring! openITCOCKPIT provides a variety of metrics for self-monitoring.
Configure Prometheus exports (scrape_config).
Navigate through all Prometheus metrics scraped from a particular host.
Map Prometheus metrics to an openITCOCKPIT service.
Create new alerting rules based on PromQL queries.