


openITCOCKPIT iOS App has been released
openITCOCKPIT
Monitoring like it's
Enterprise approved open source infrastructure monitoring
Demo Documentation GitHub Download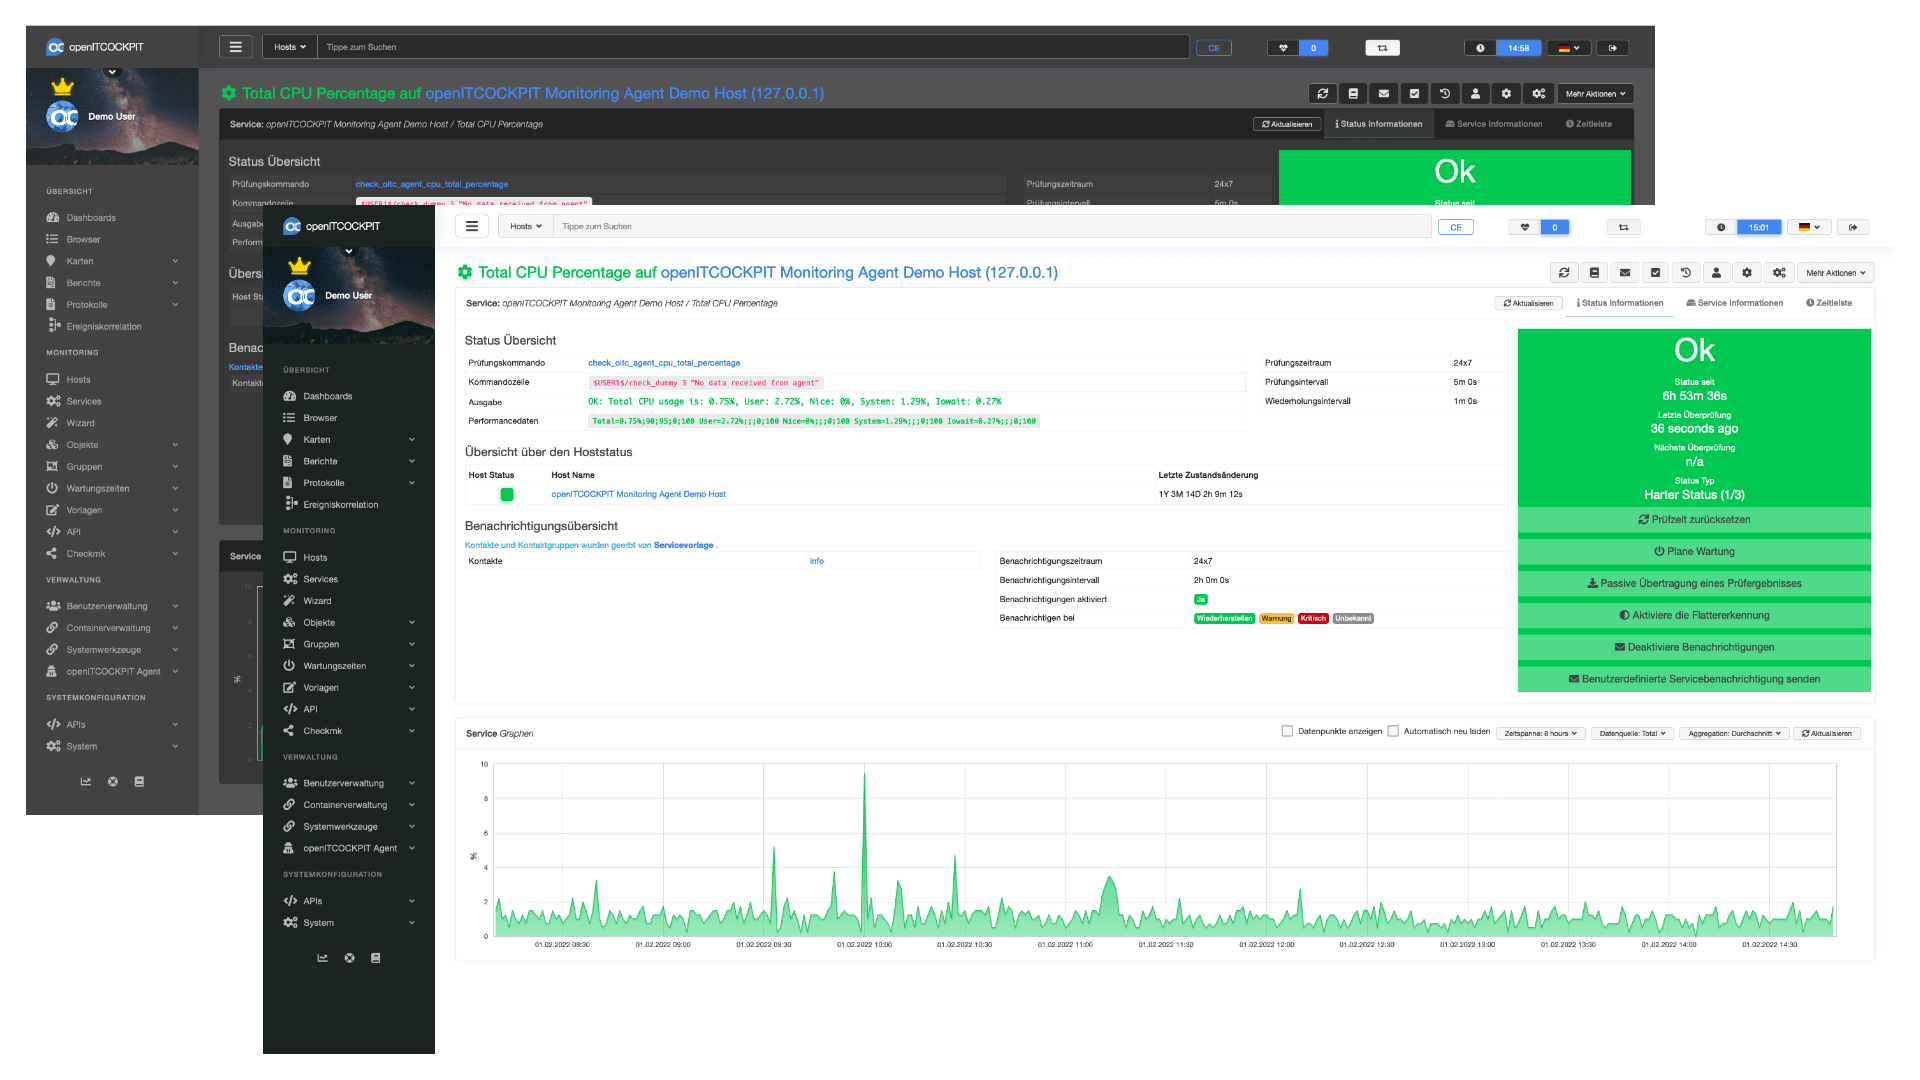
Enterprise approved open source infrastructure monitoring
Demo Documentation GitHub Download


Configuration and visualisation web frontend for Nagios, Naemon and Prometheus including JSON API and user permissions

openITCOCKPIT provides an own Monitoring Agent for Windows, Linux and macOS. In addition thousands of community plugins are available.

openITCOCKPIT receives frequently feature and security updates. Updates are seamlessly handled by the distribution's package manager.
openITCOCKPIT is a modern monitoring framework designed to monitor everything. Baremetal servers, virtual machines, network devices, applications, containers, cloud environments or Internet of things - openITCOCKPIT got you covered.
openITCOCKPIT makes use of Naemon as monitoring engine and is 100% compatible with Nagios. Beside a huge set of pre-configured templates and plugins the open source community provides thousands of plugins to pick from.


Combine traditional status monitoring with metrics based monitoring. Get one central monitoring server for traditional IT infrastructure up to Industry 4.0.
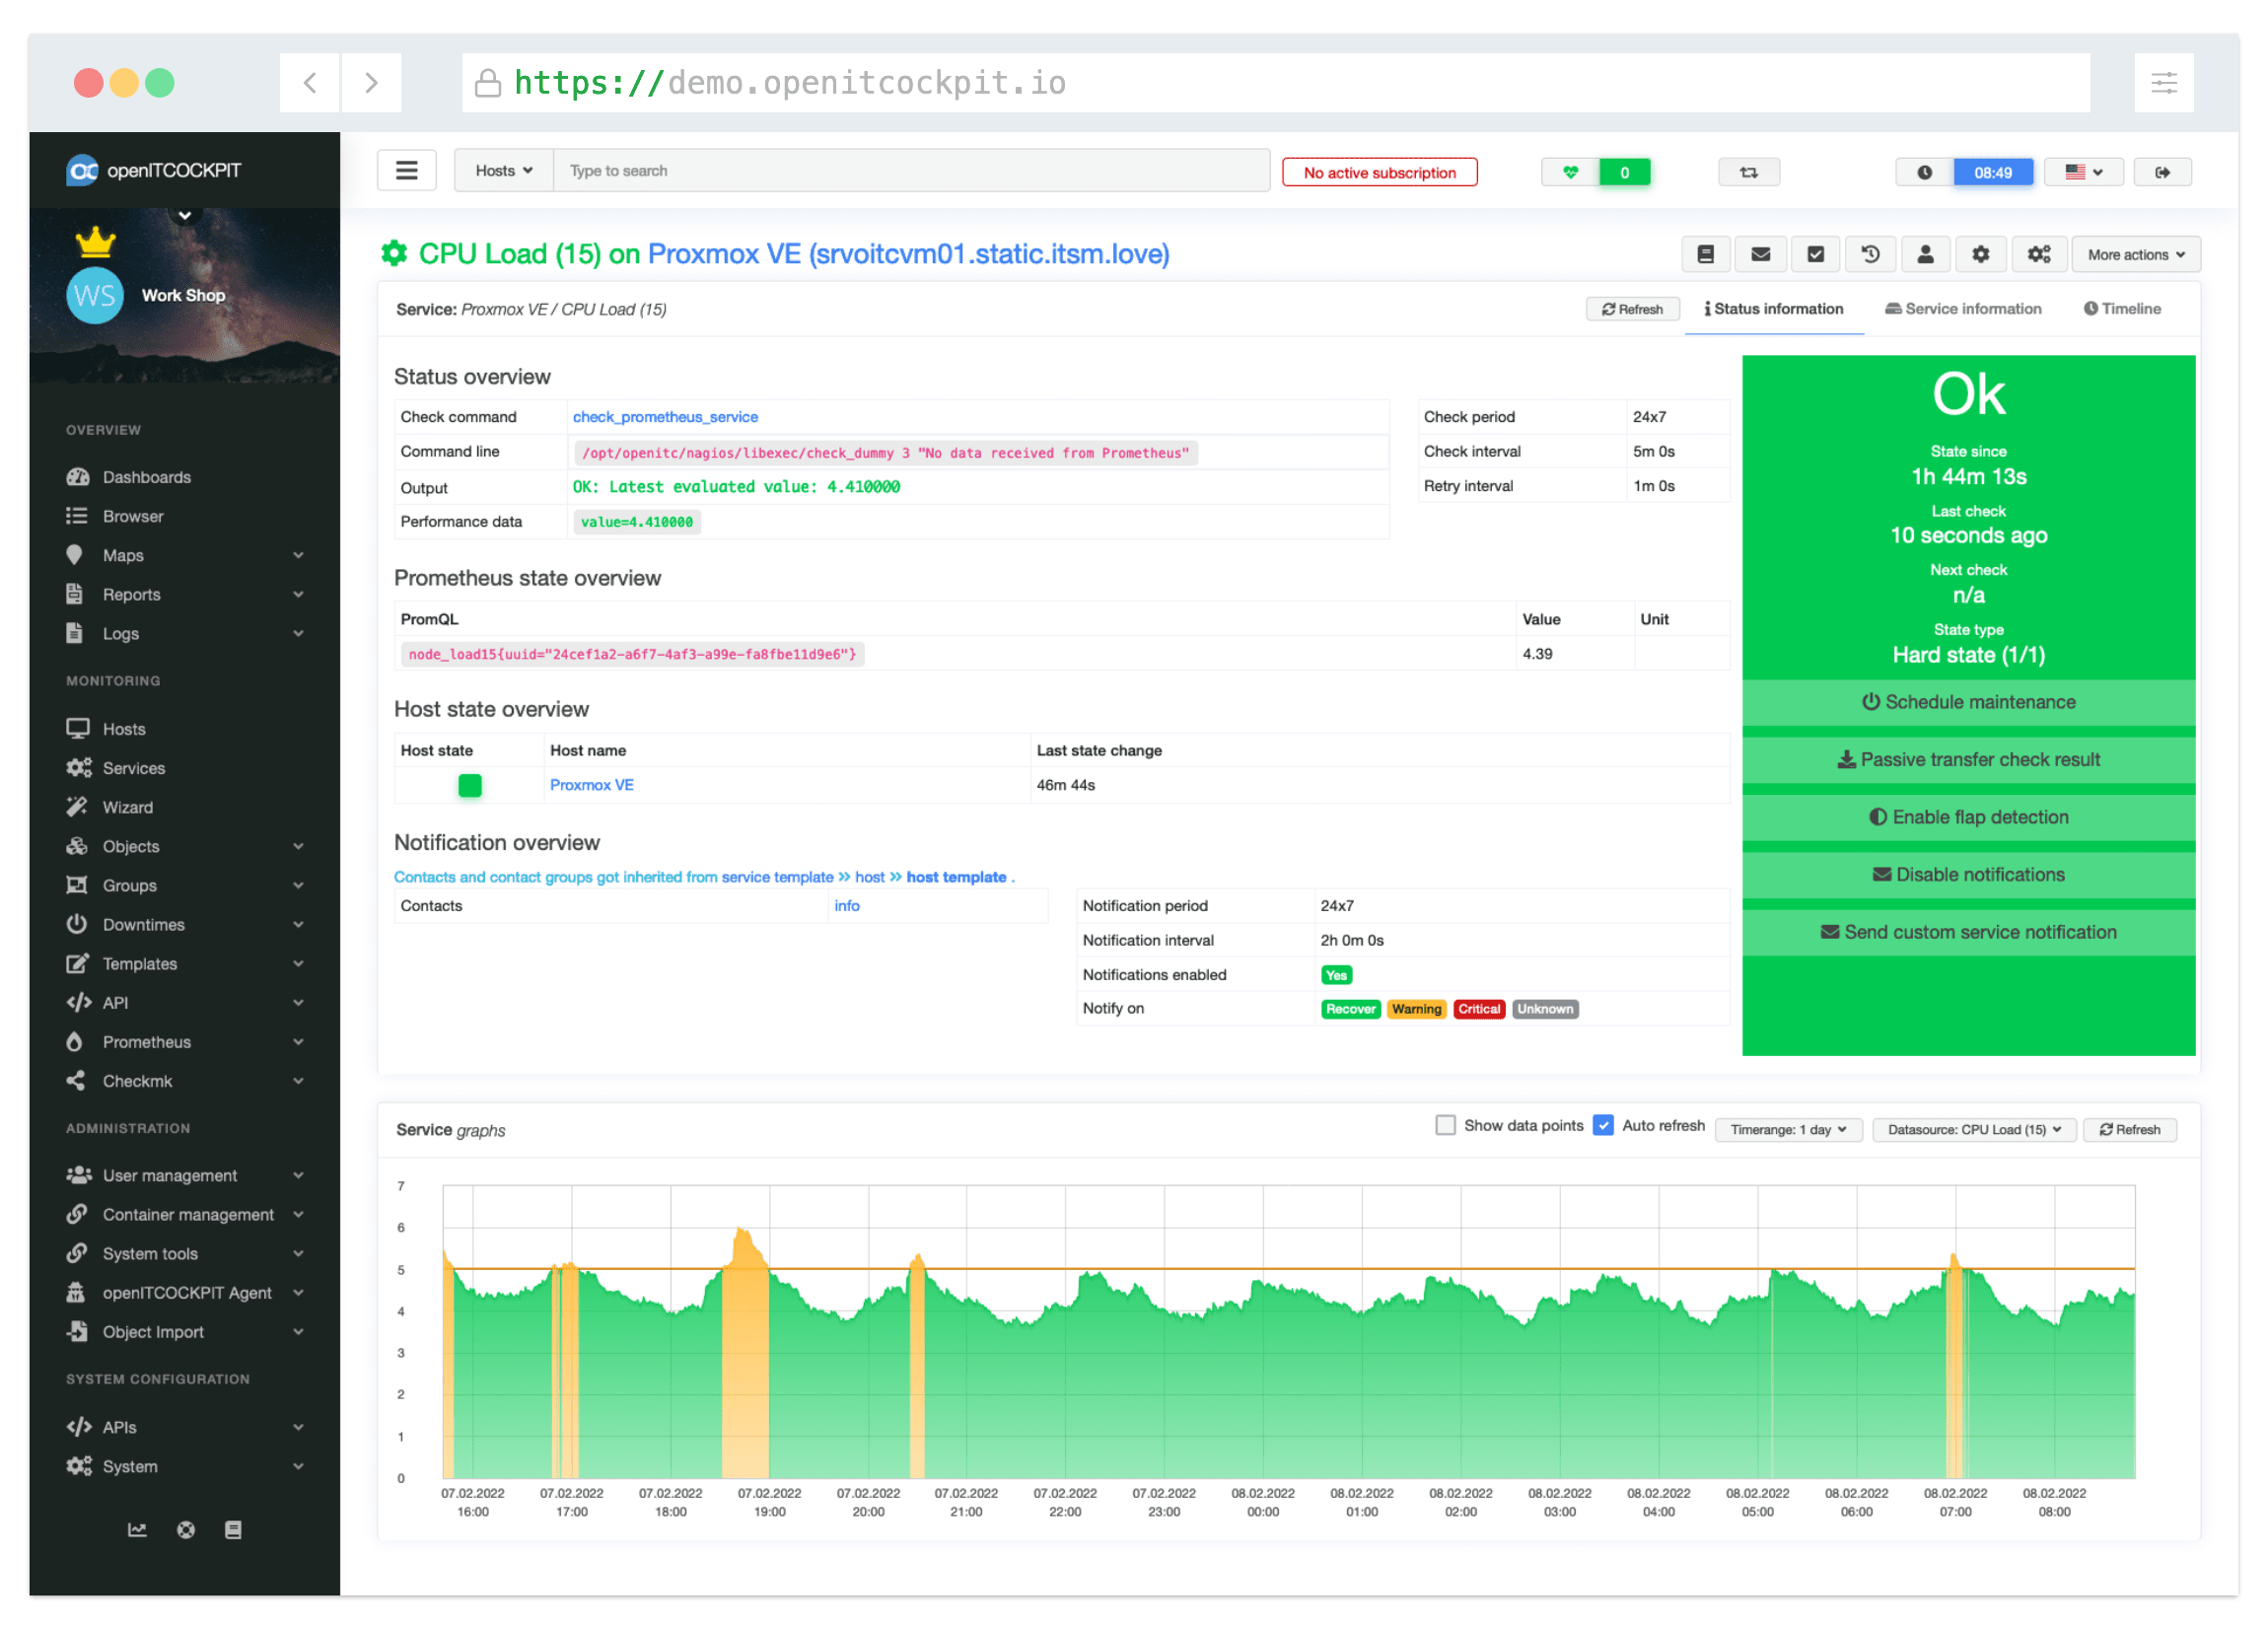
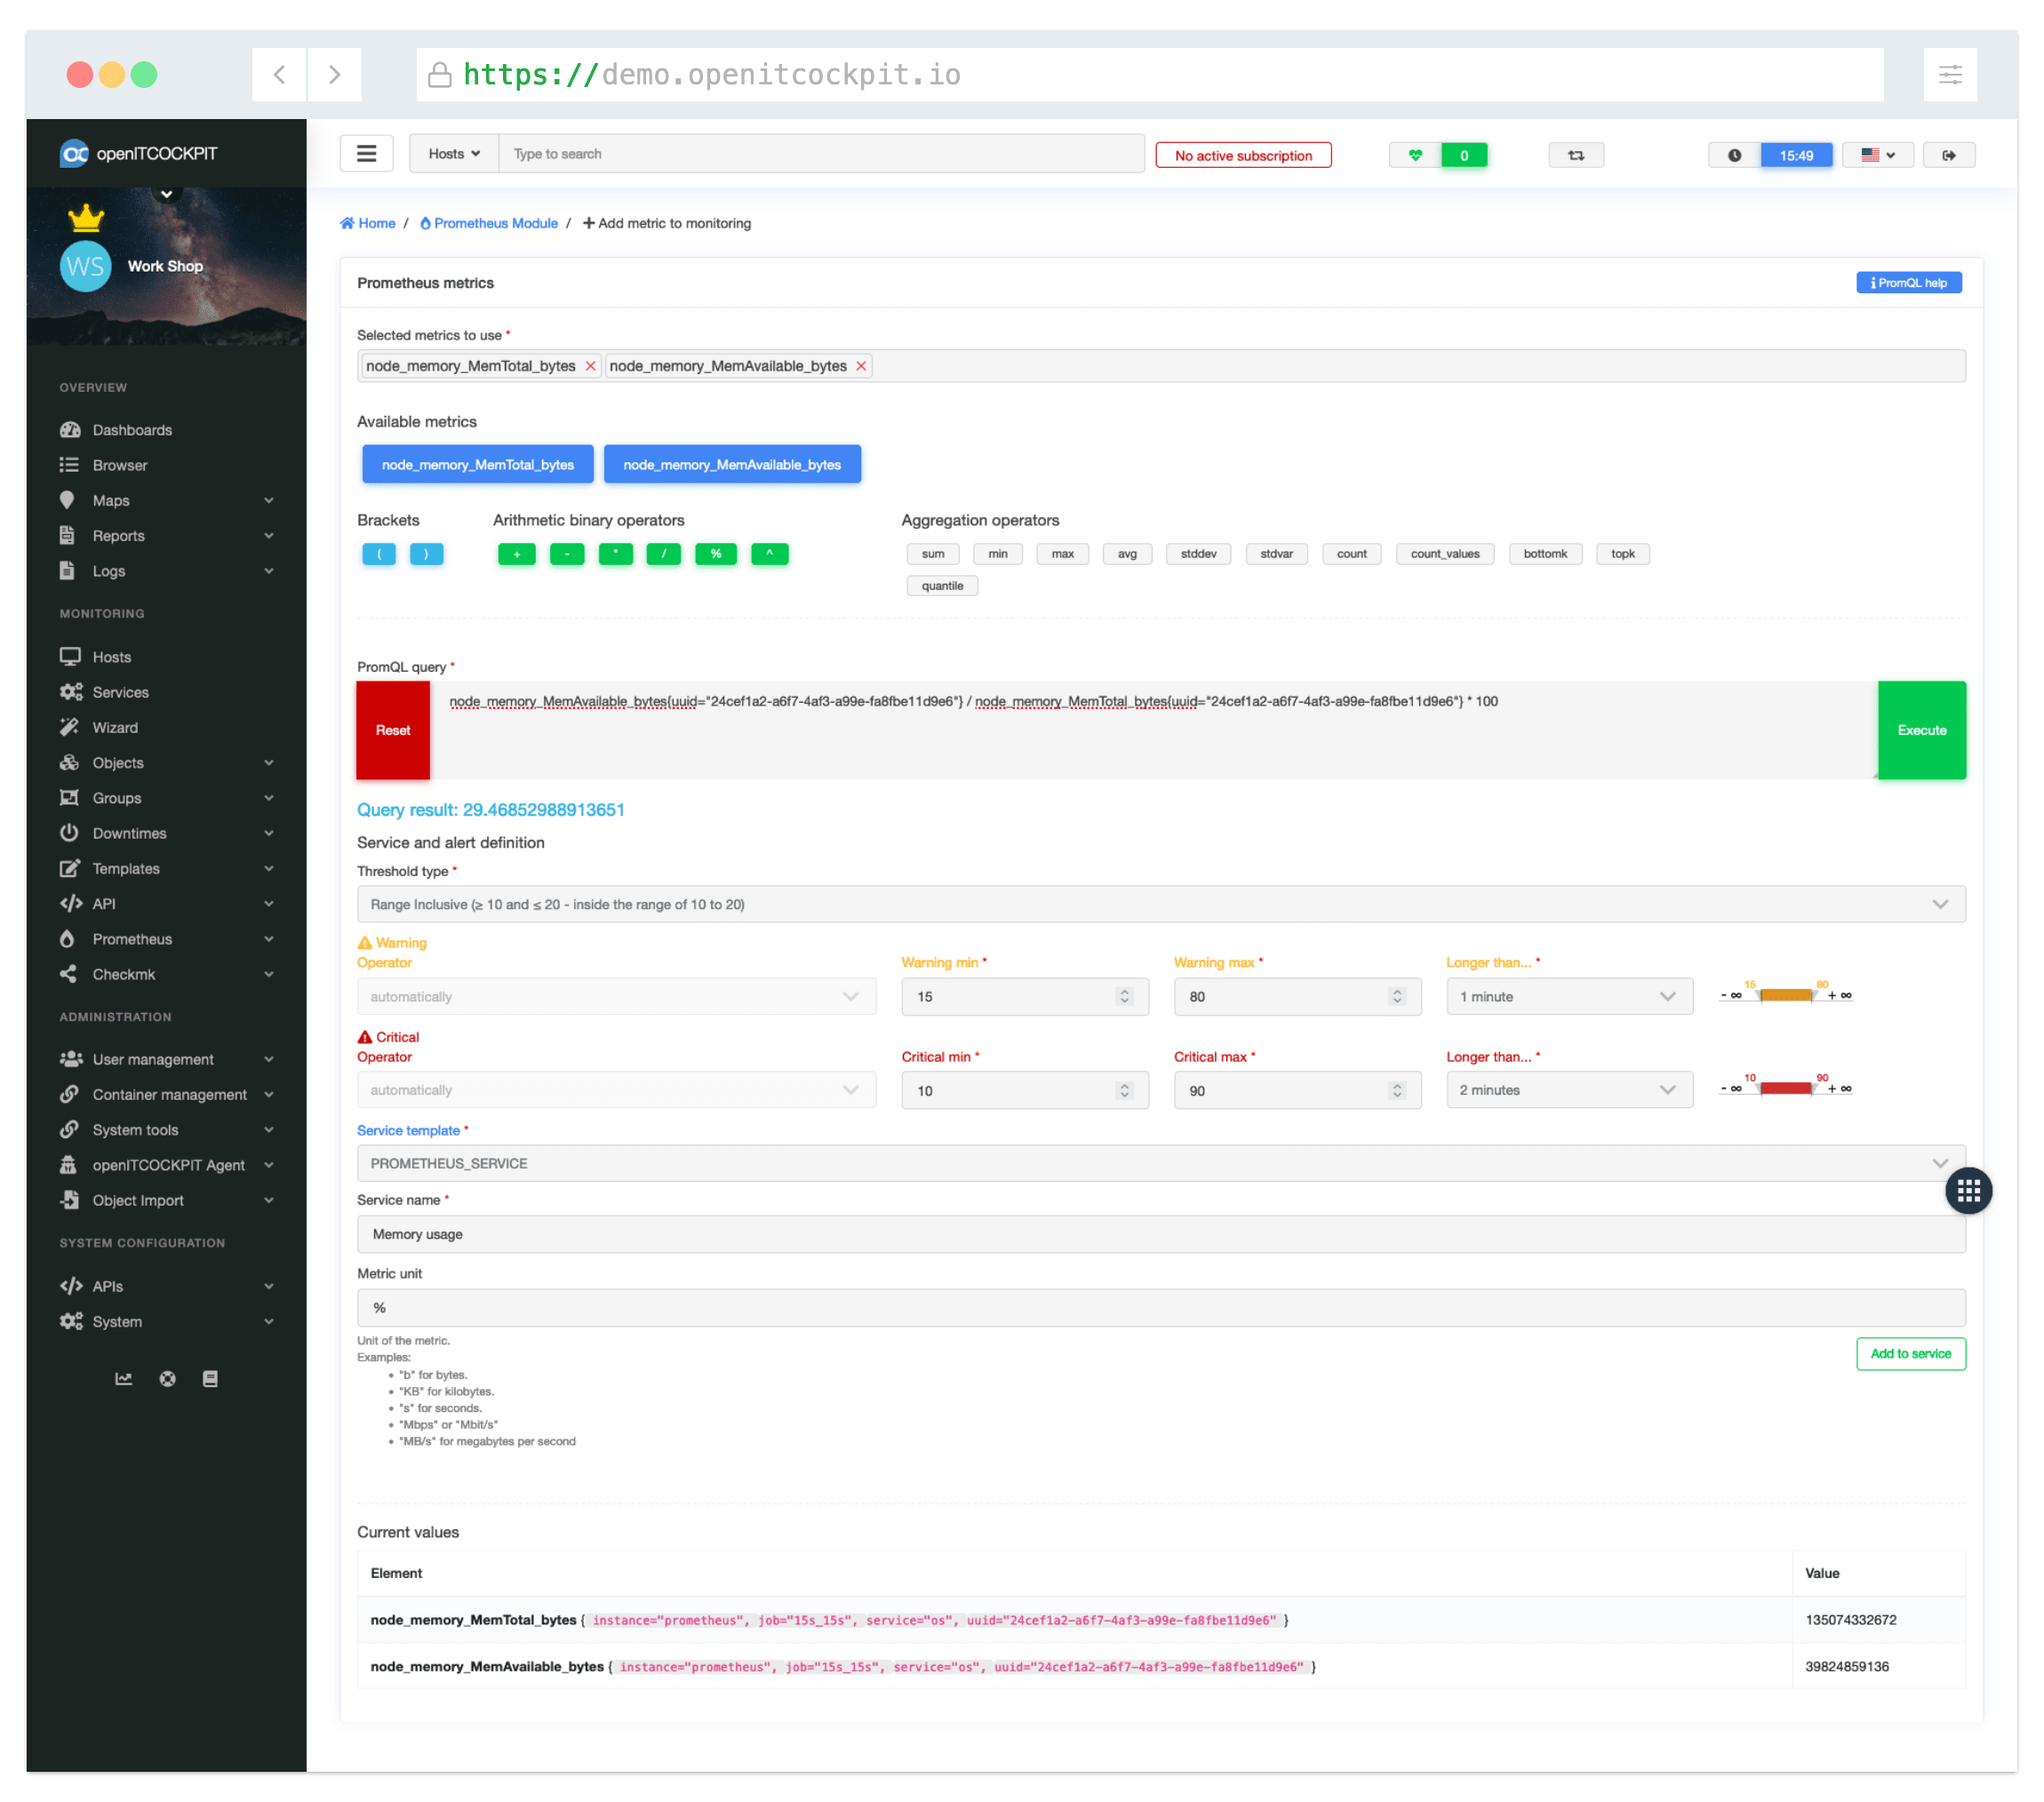
openITCOCKPIT has configuration GUI especially for Prometheus, so you don't have to bother with PromQL too much.

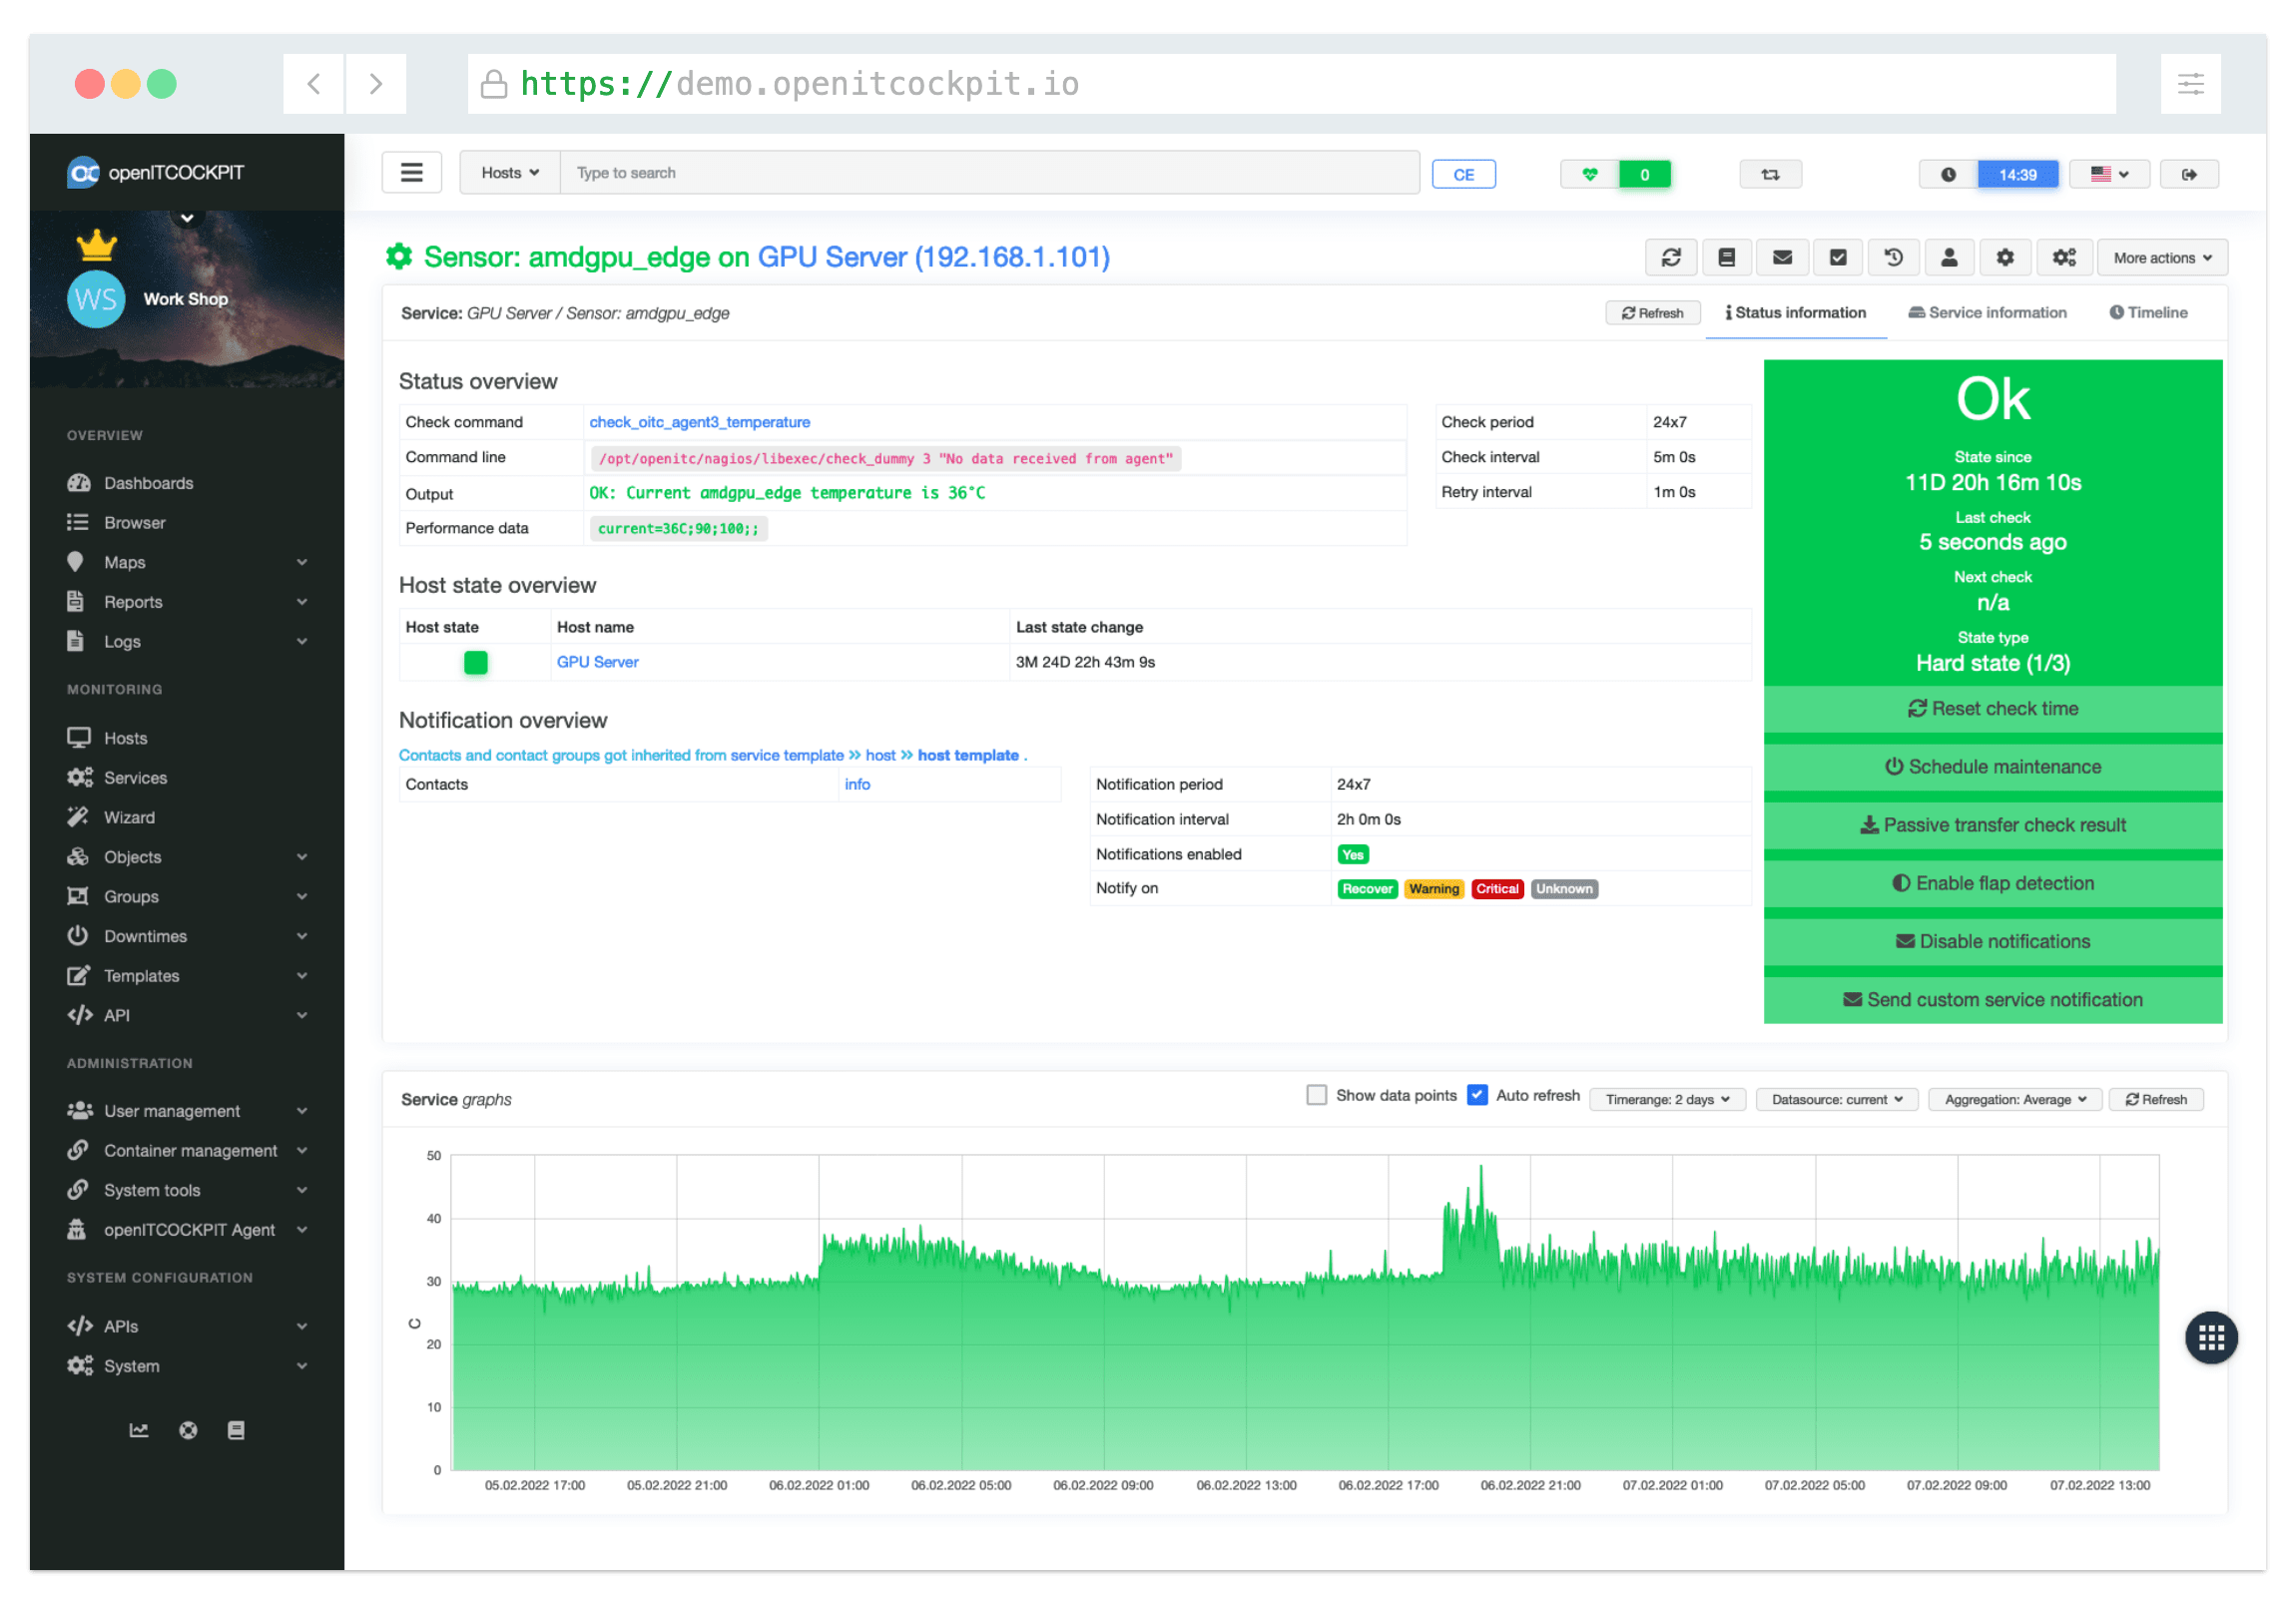
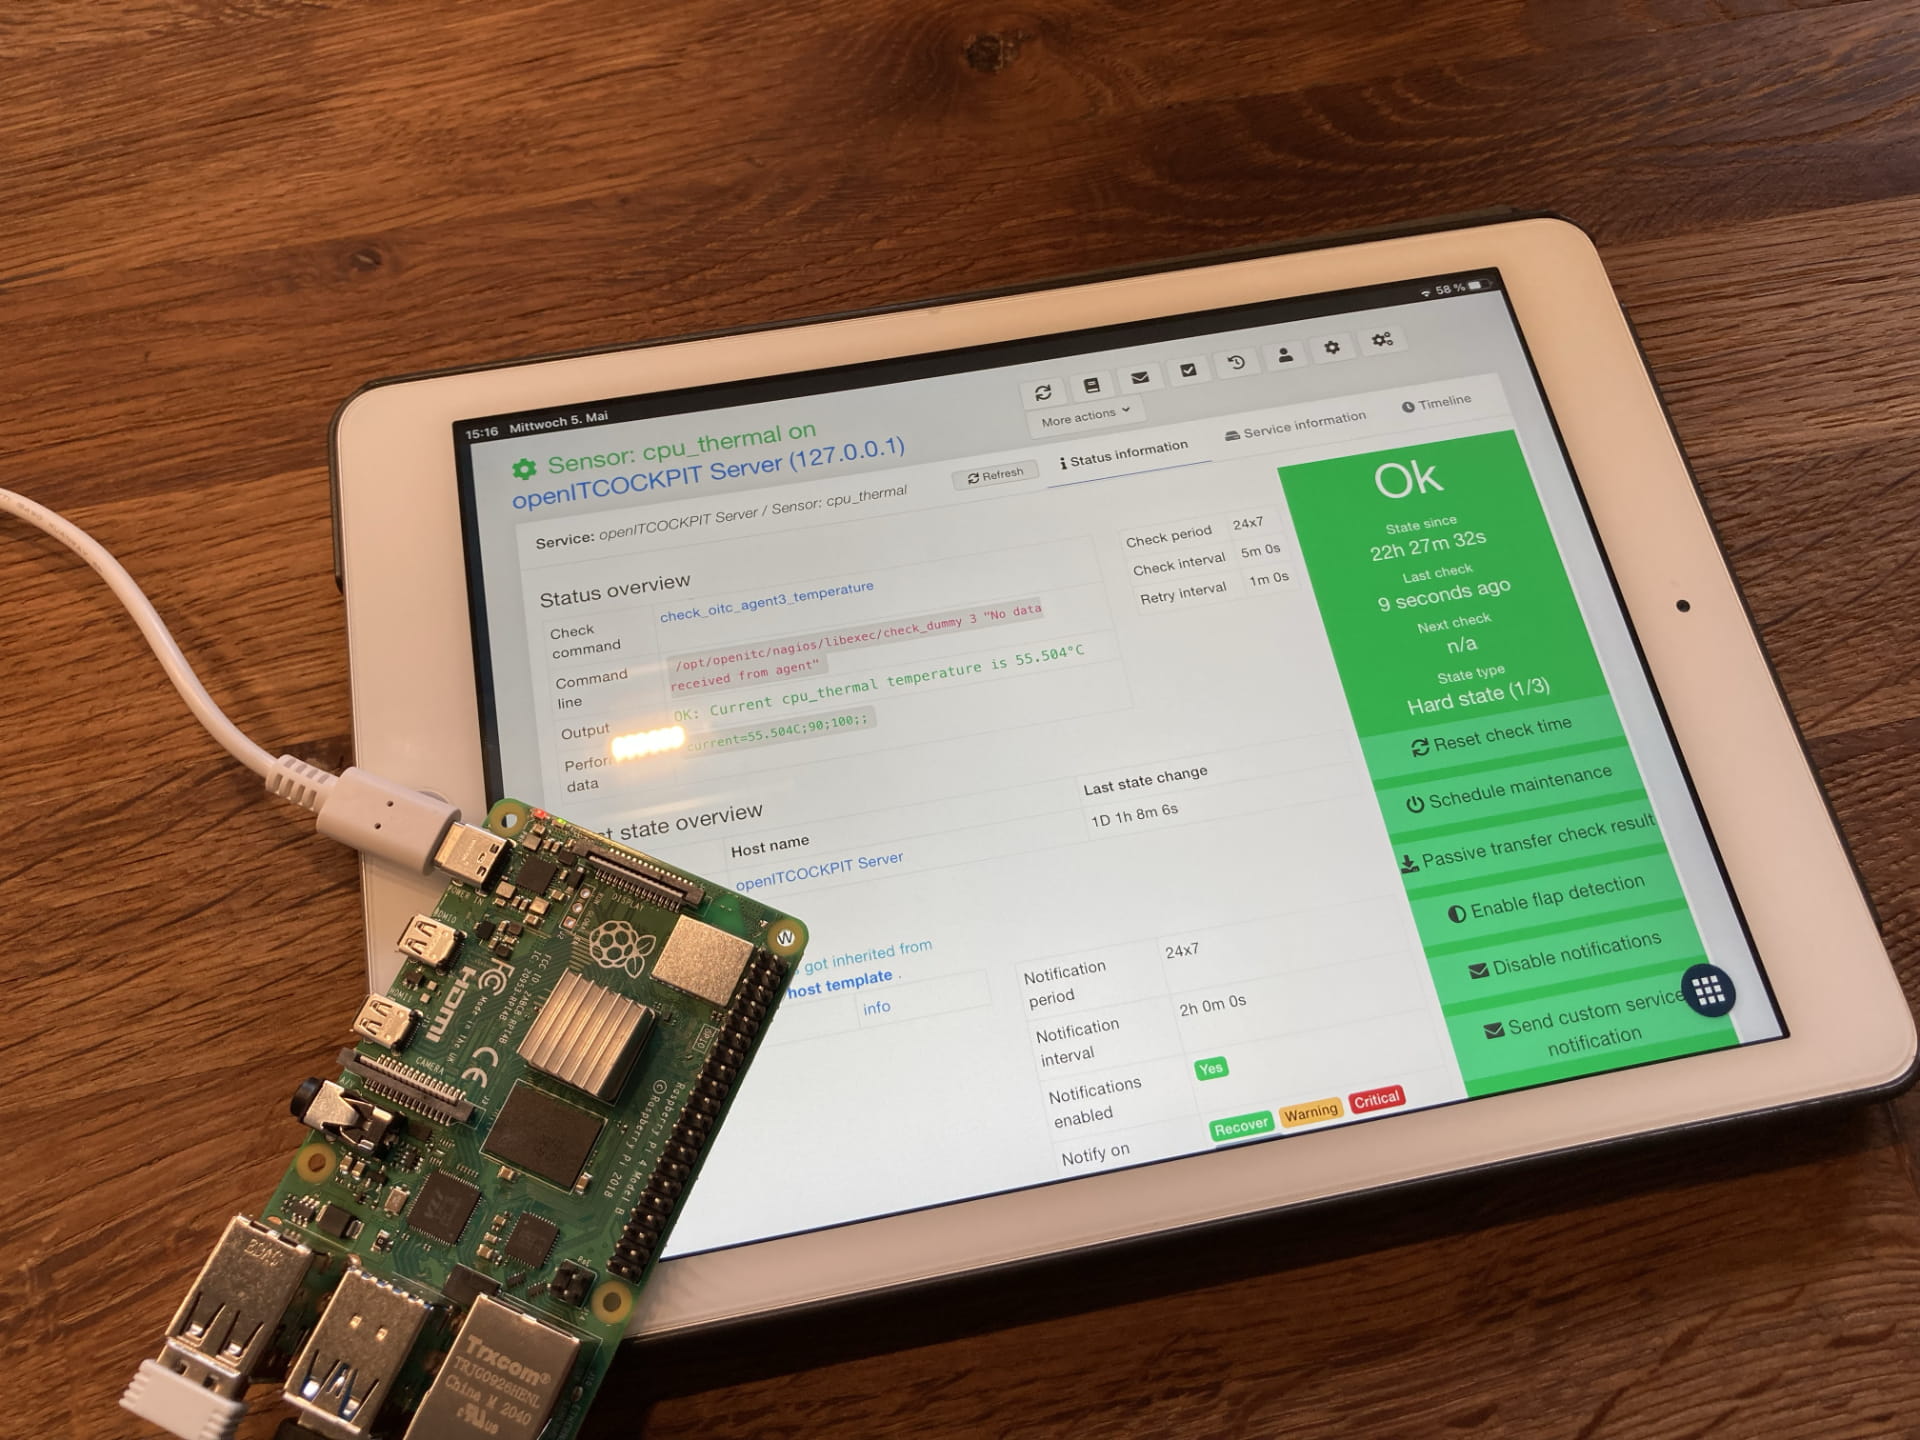
Single binary cross-platform monitoring agent for Windows, Linux and macOS. Out-of-the-box the openITCOCKPIT Monitoring Agent will monitor CPU, memory and disk usage, network interfaces, system services, running processes, temperature sensors, QEMU and Docker containers.
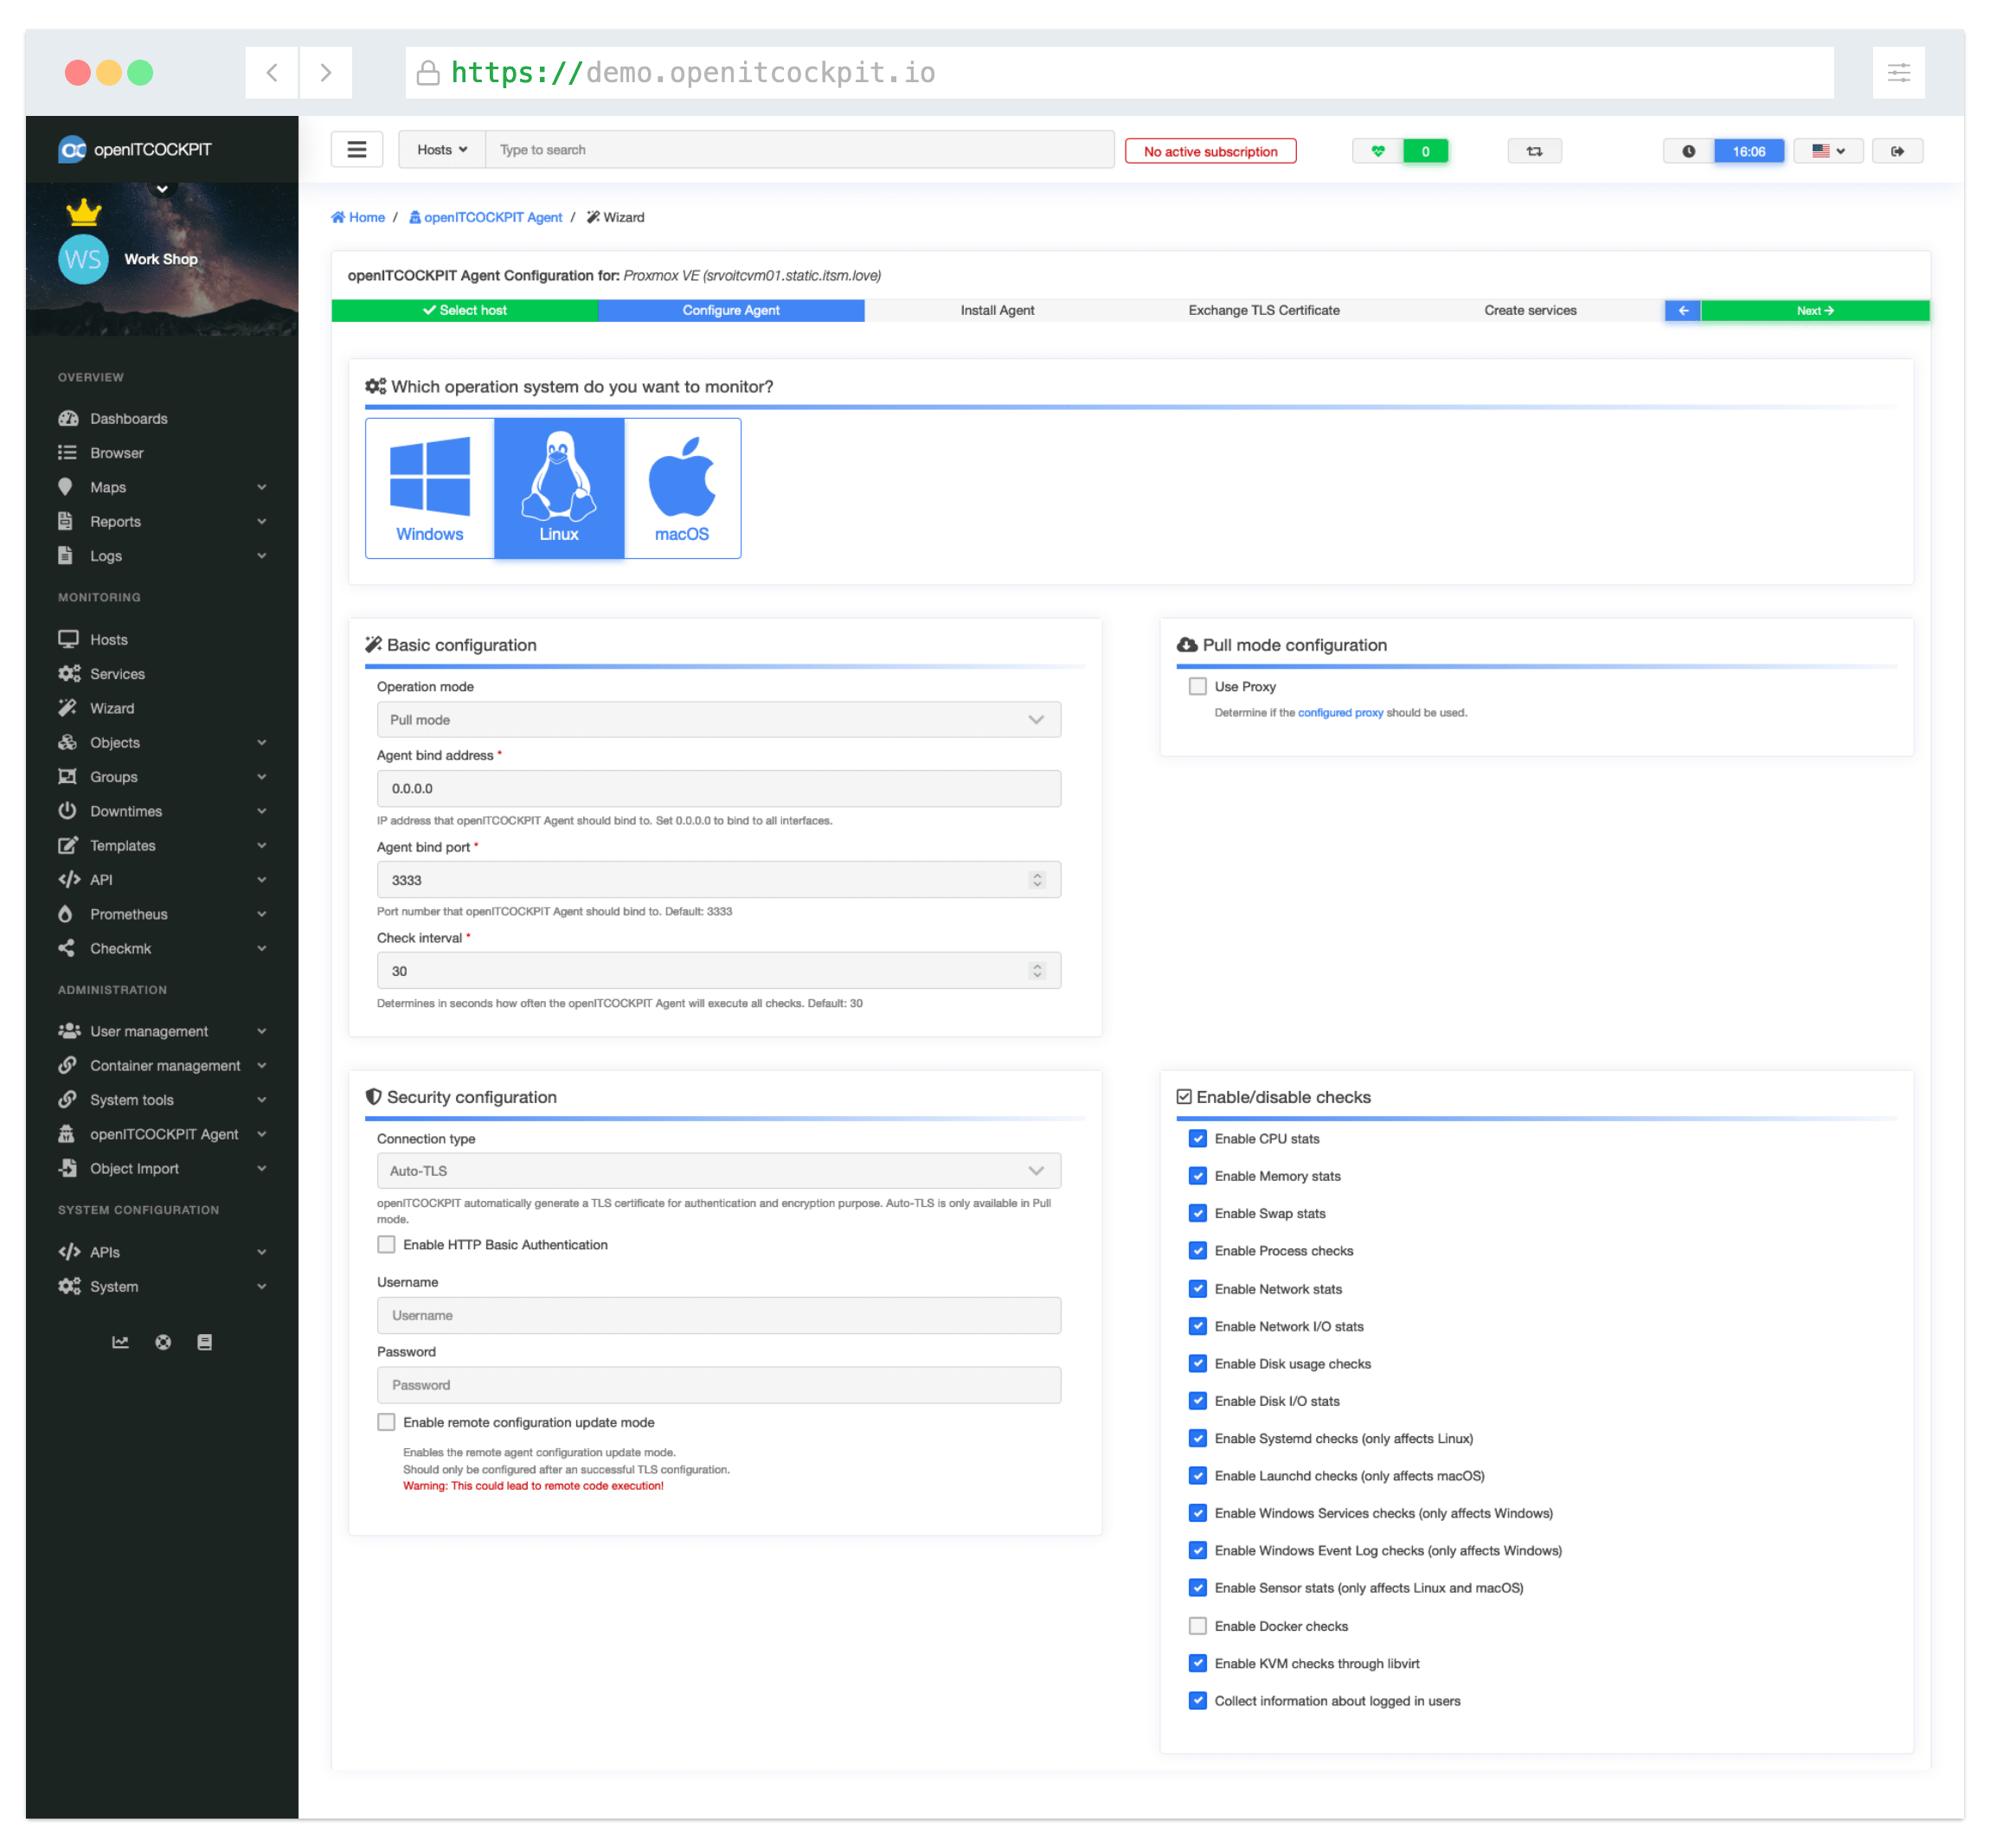
Both openITCOCKPIT and the openITCOCKPIT Monitoring Agent are using TLS/SSL by default.
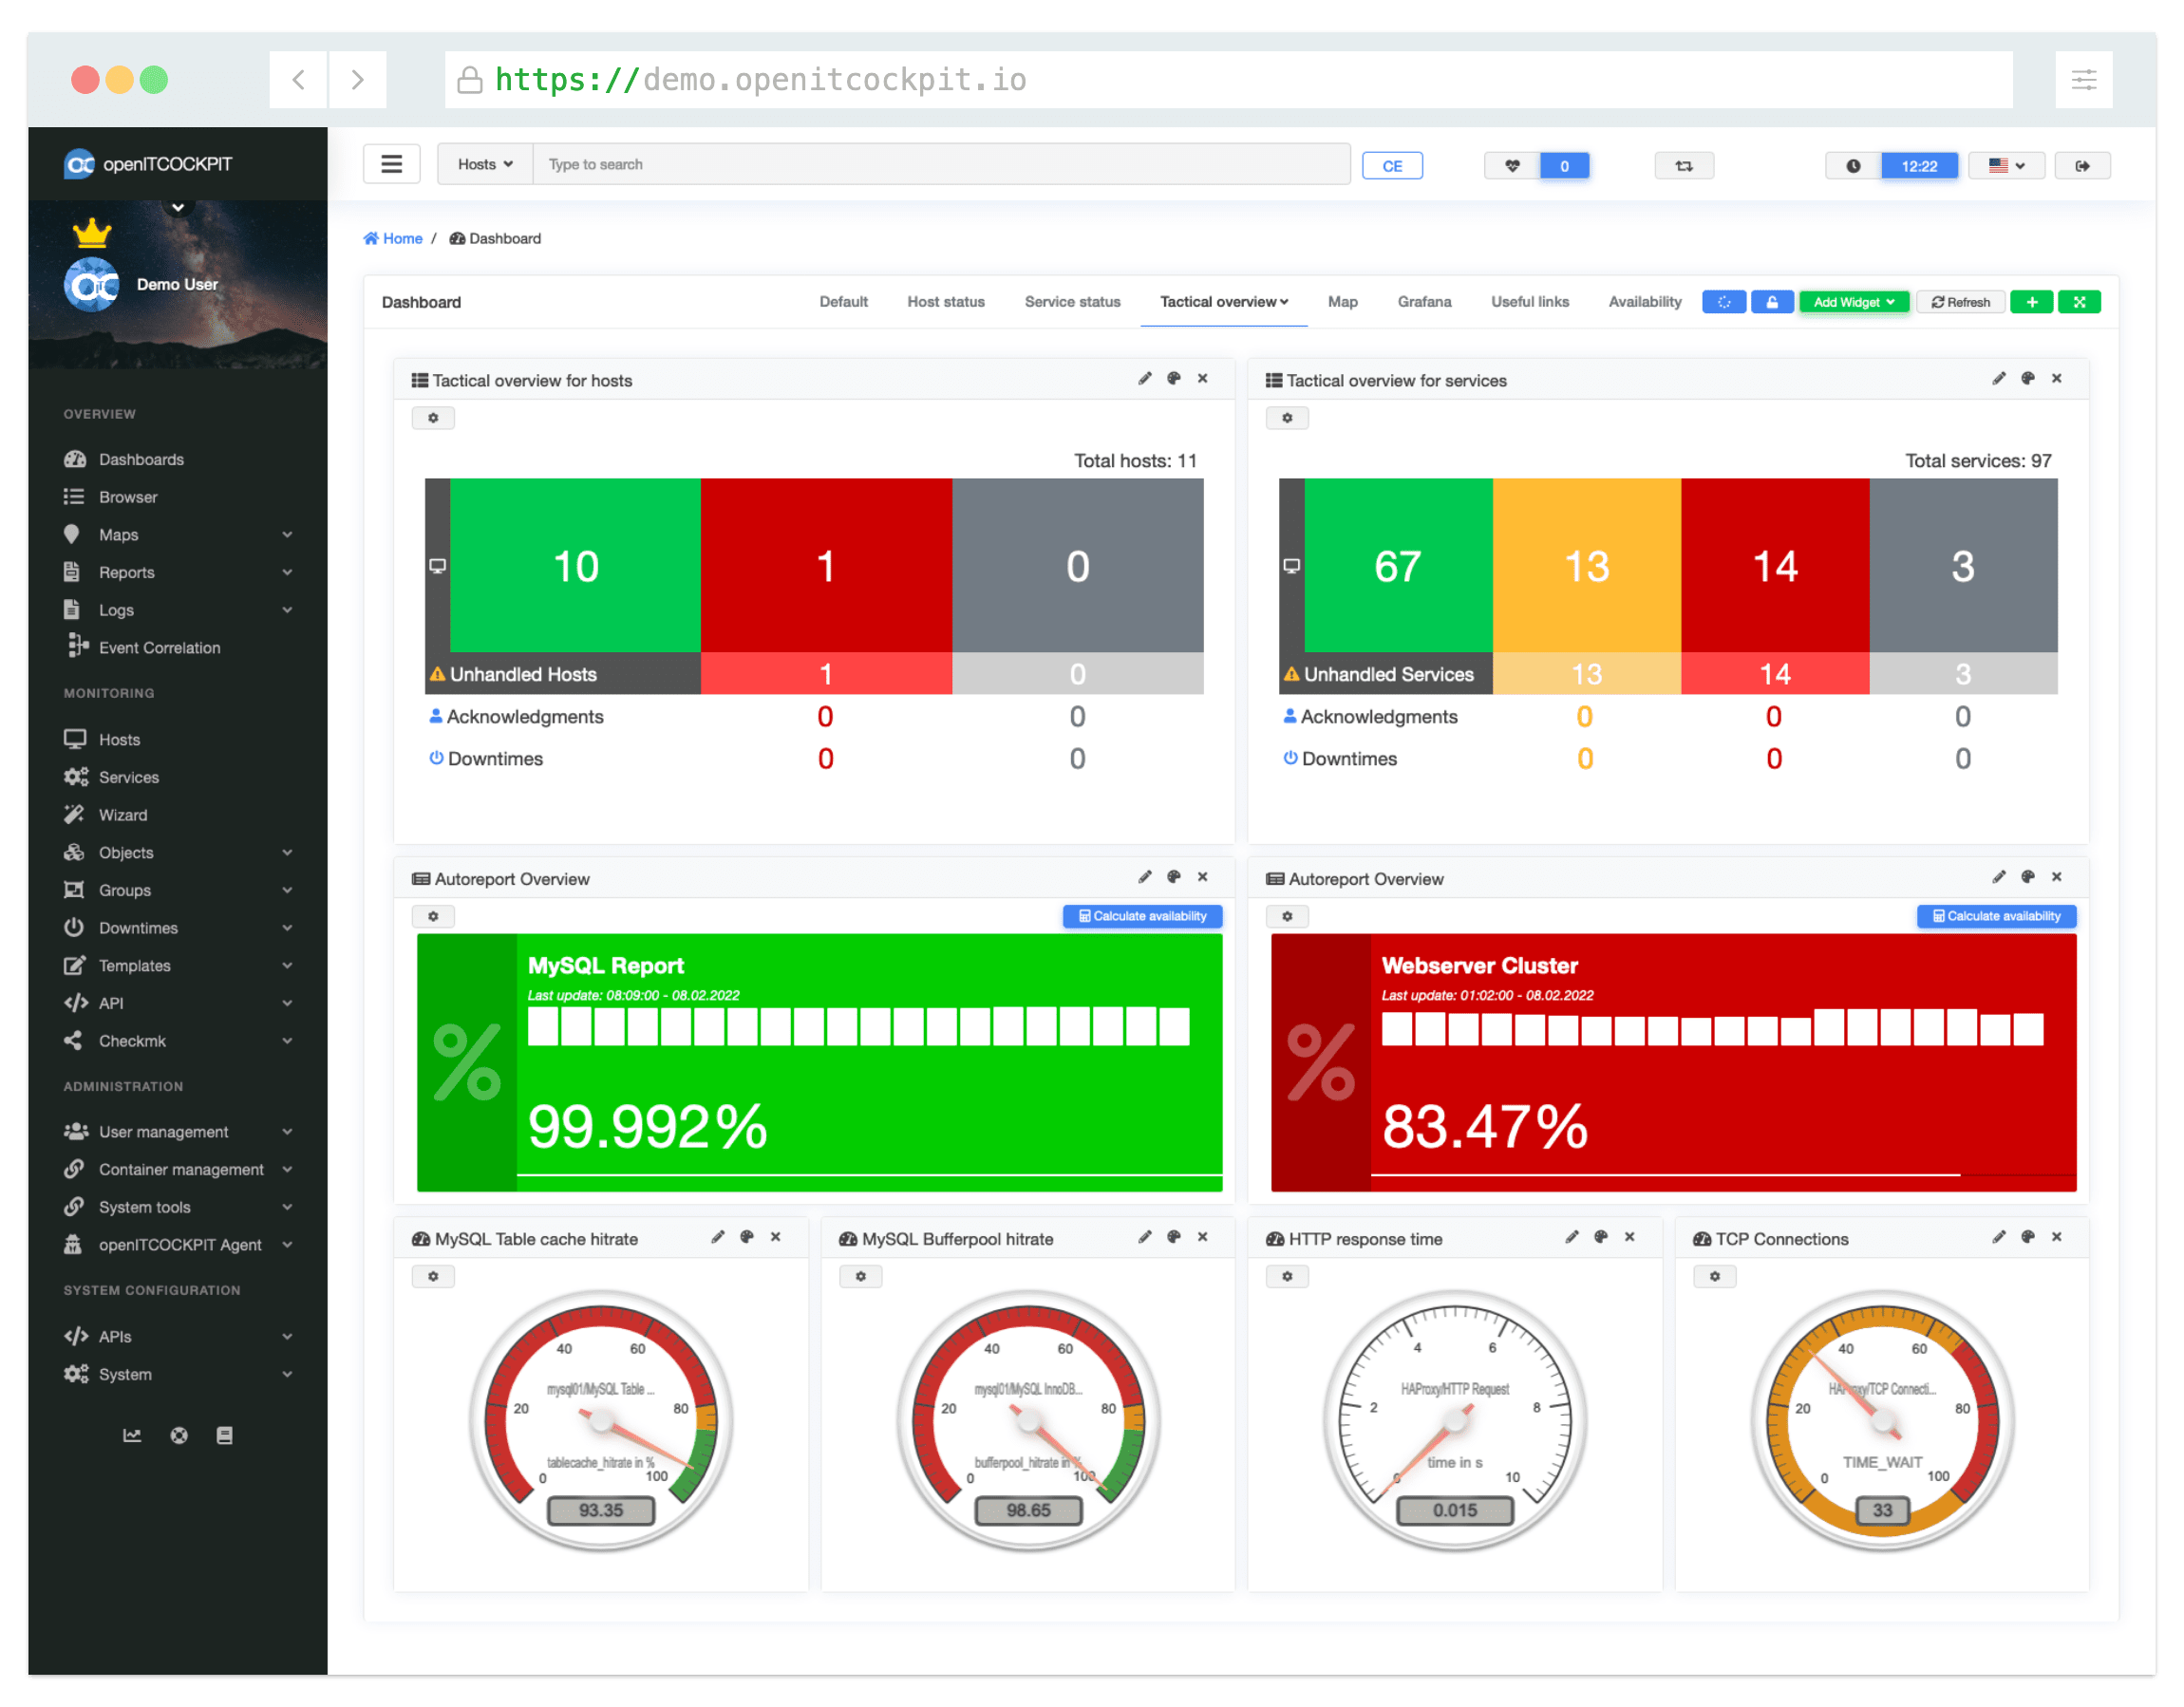
Users can create custom dashboards and share them with their colleagues. Traffic lights, Tachometers, tiles and tables are available to visualize the current state.
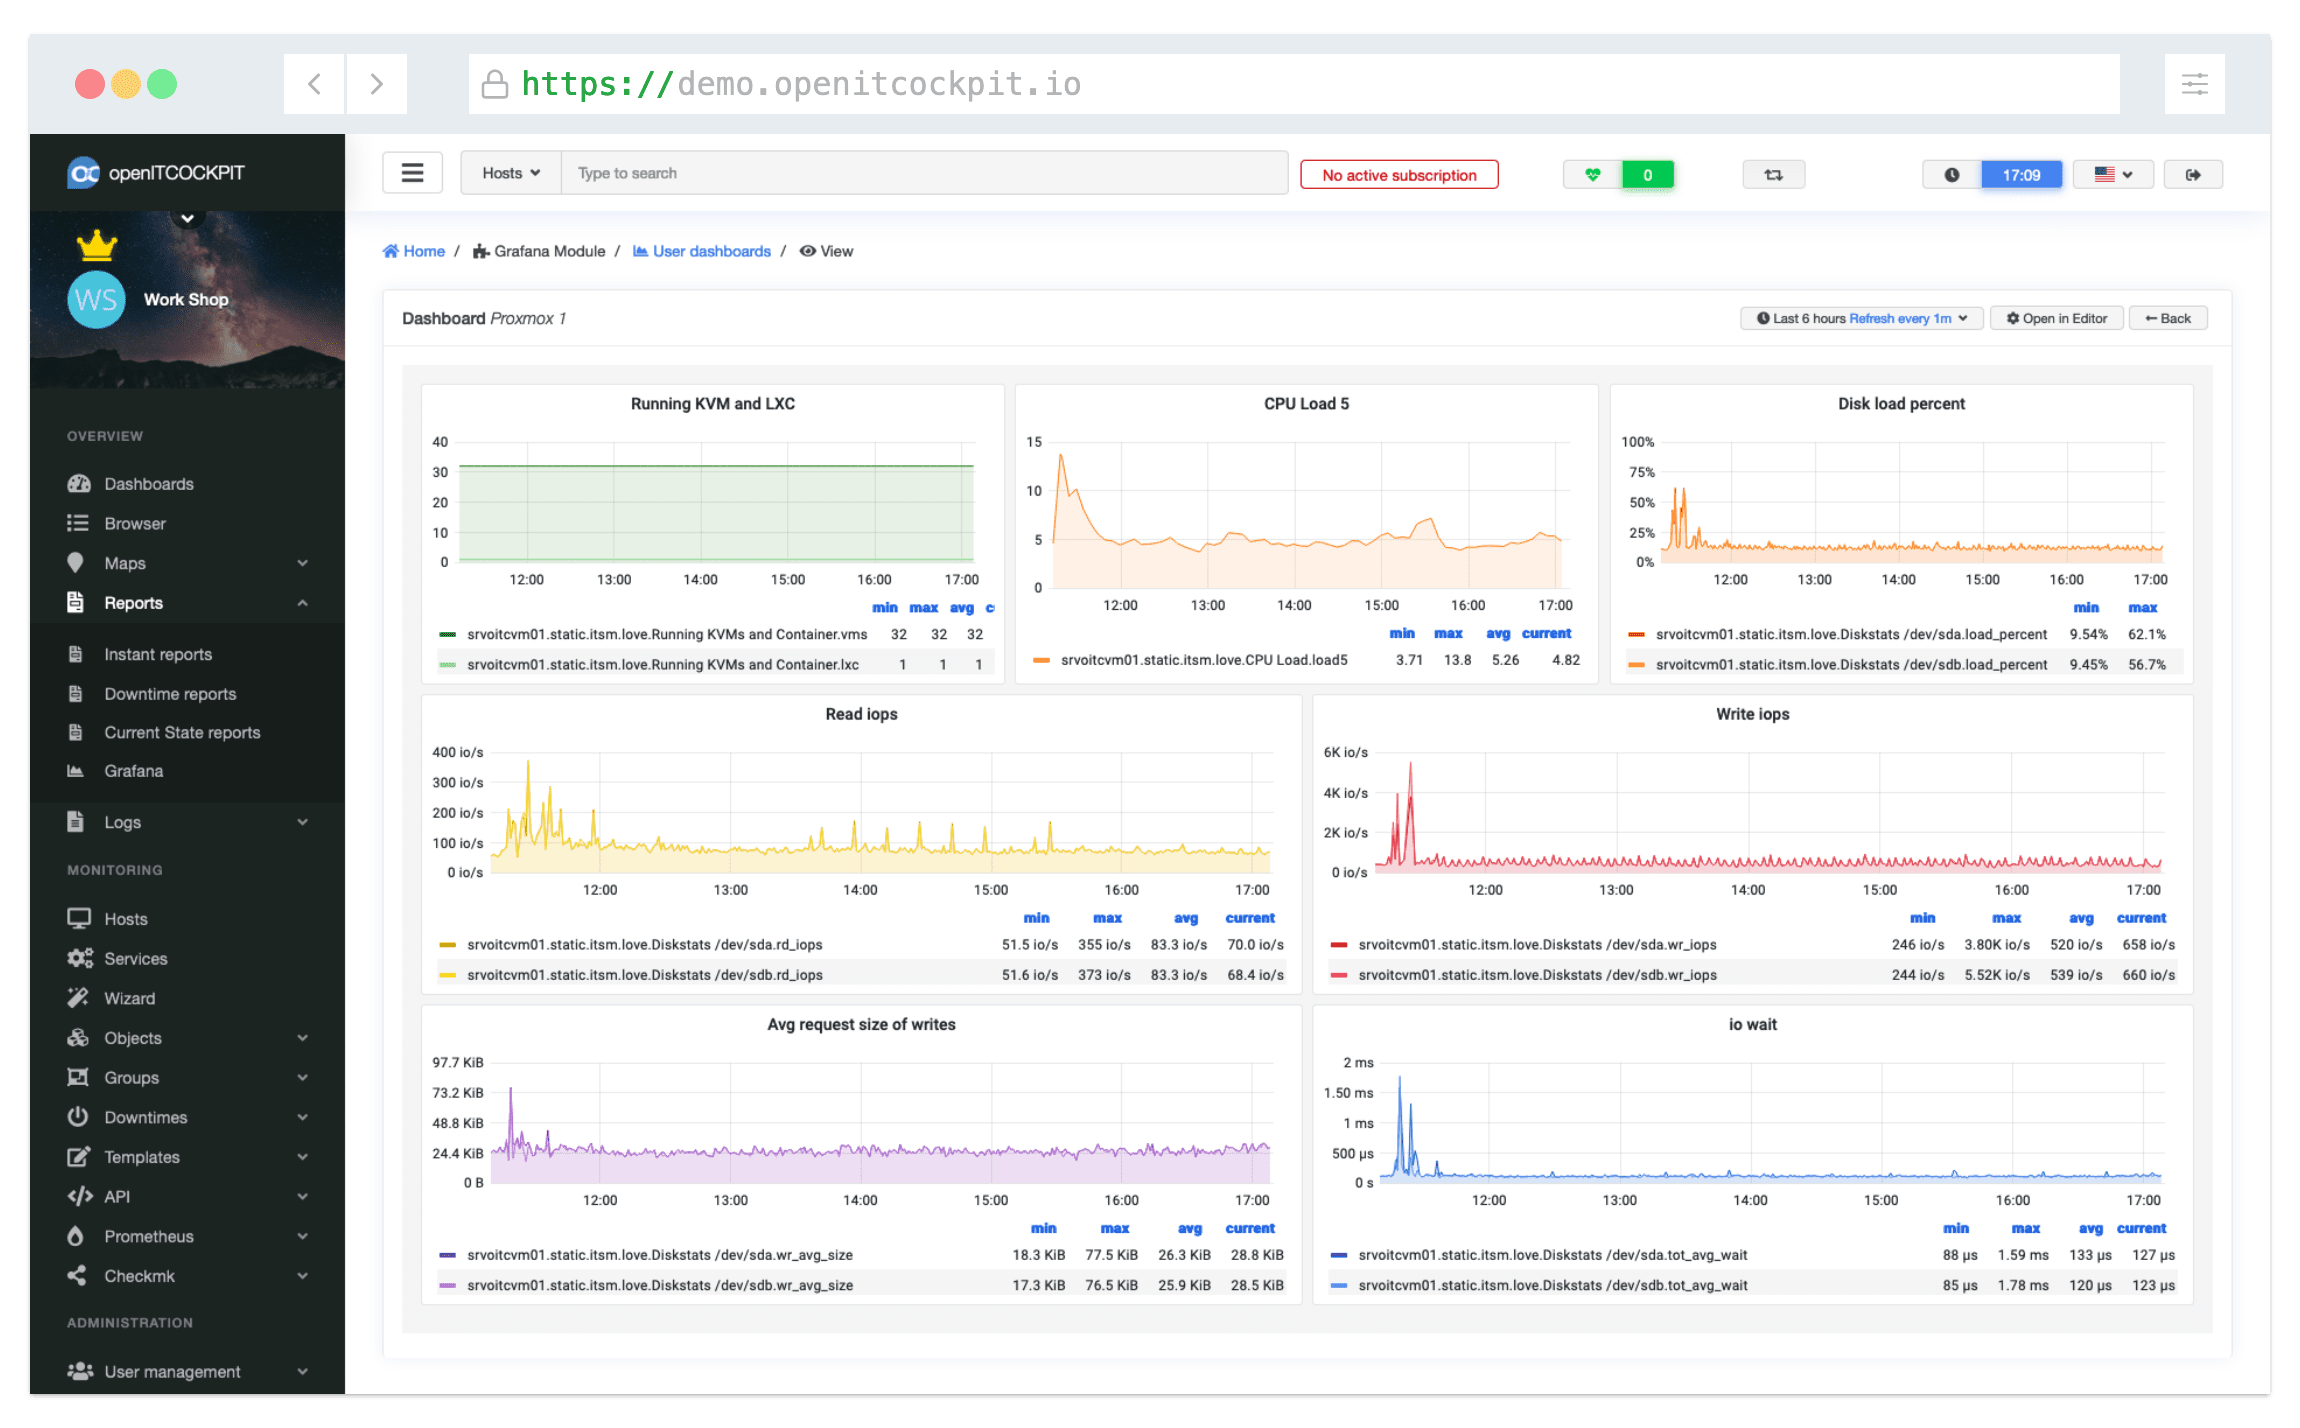
Grafana has become the de facto standard for dashboarding and charting and is therefore part of openITCOCKPIT by default. openITCOCKPIT will automatically generate a Grafana dashboard for each host. In addition, users can create custom Grafana dashboards via the openITCOCKPIT interface.
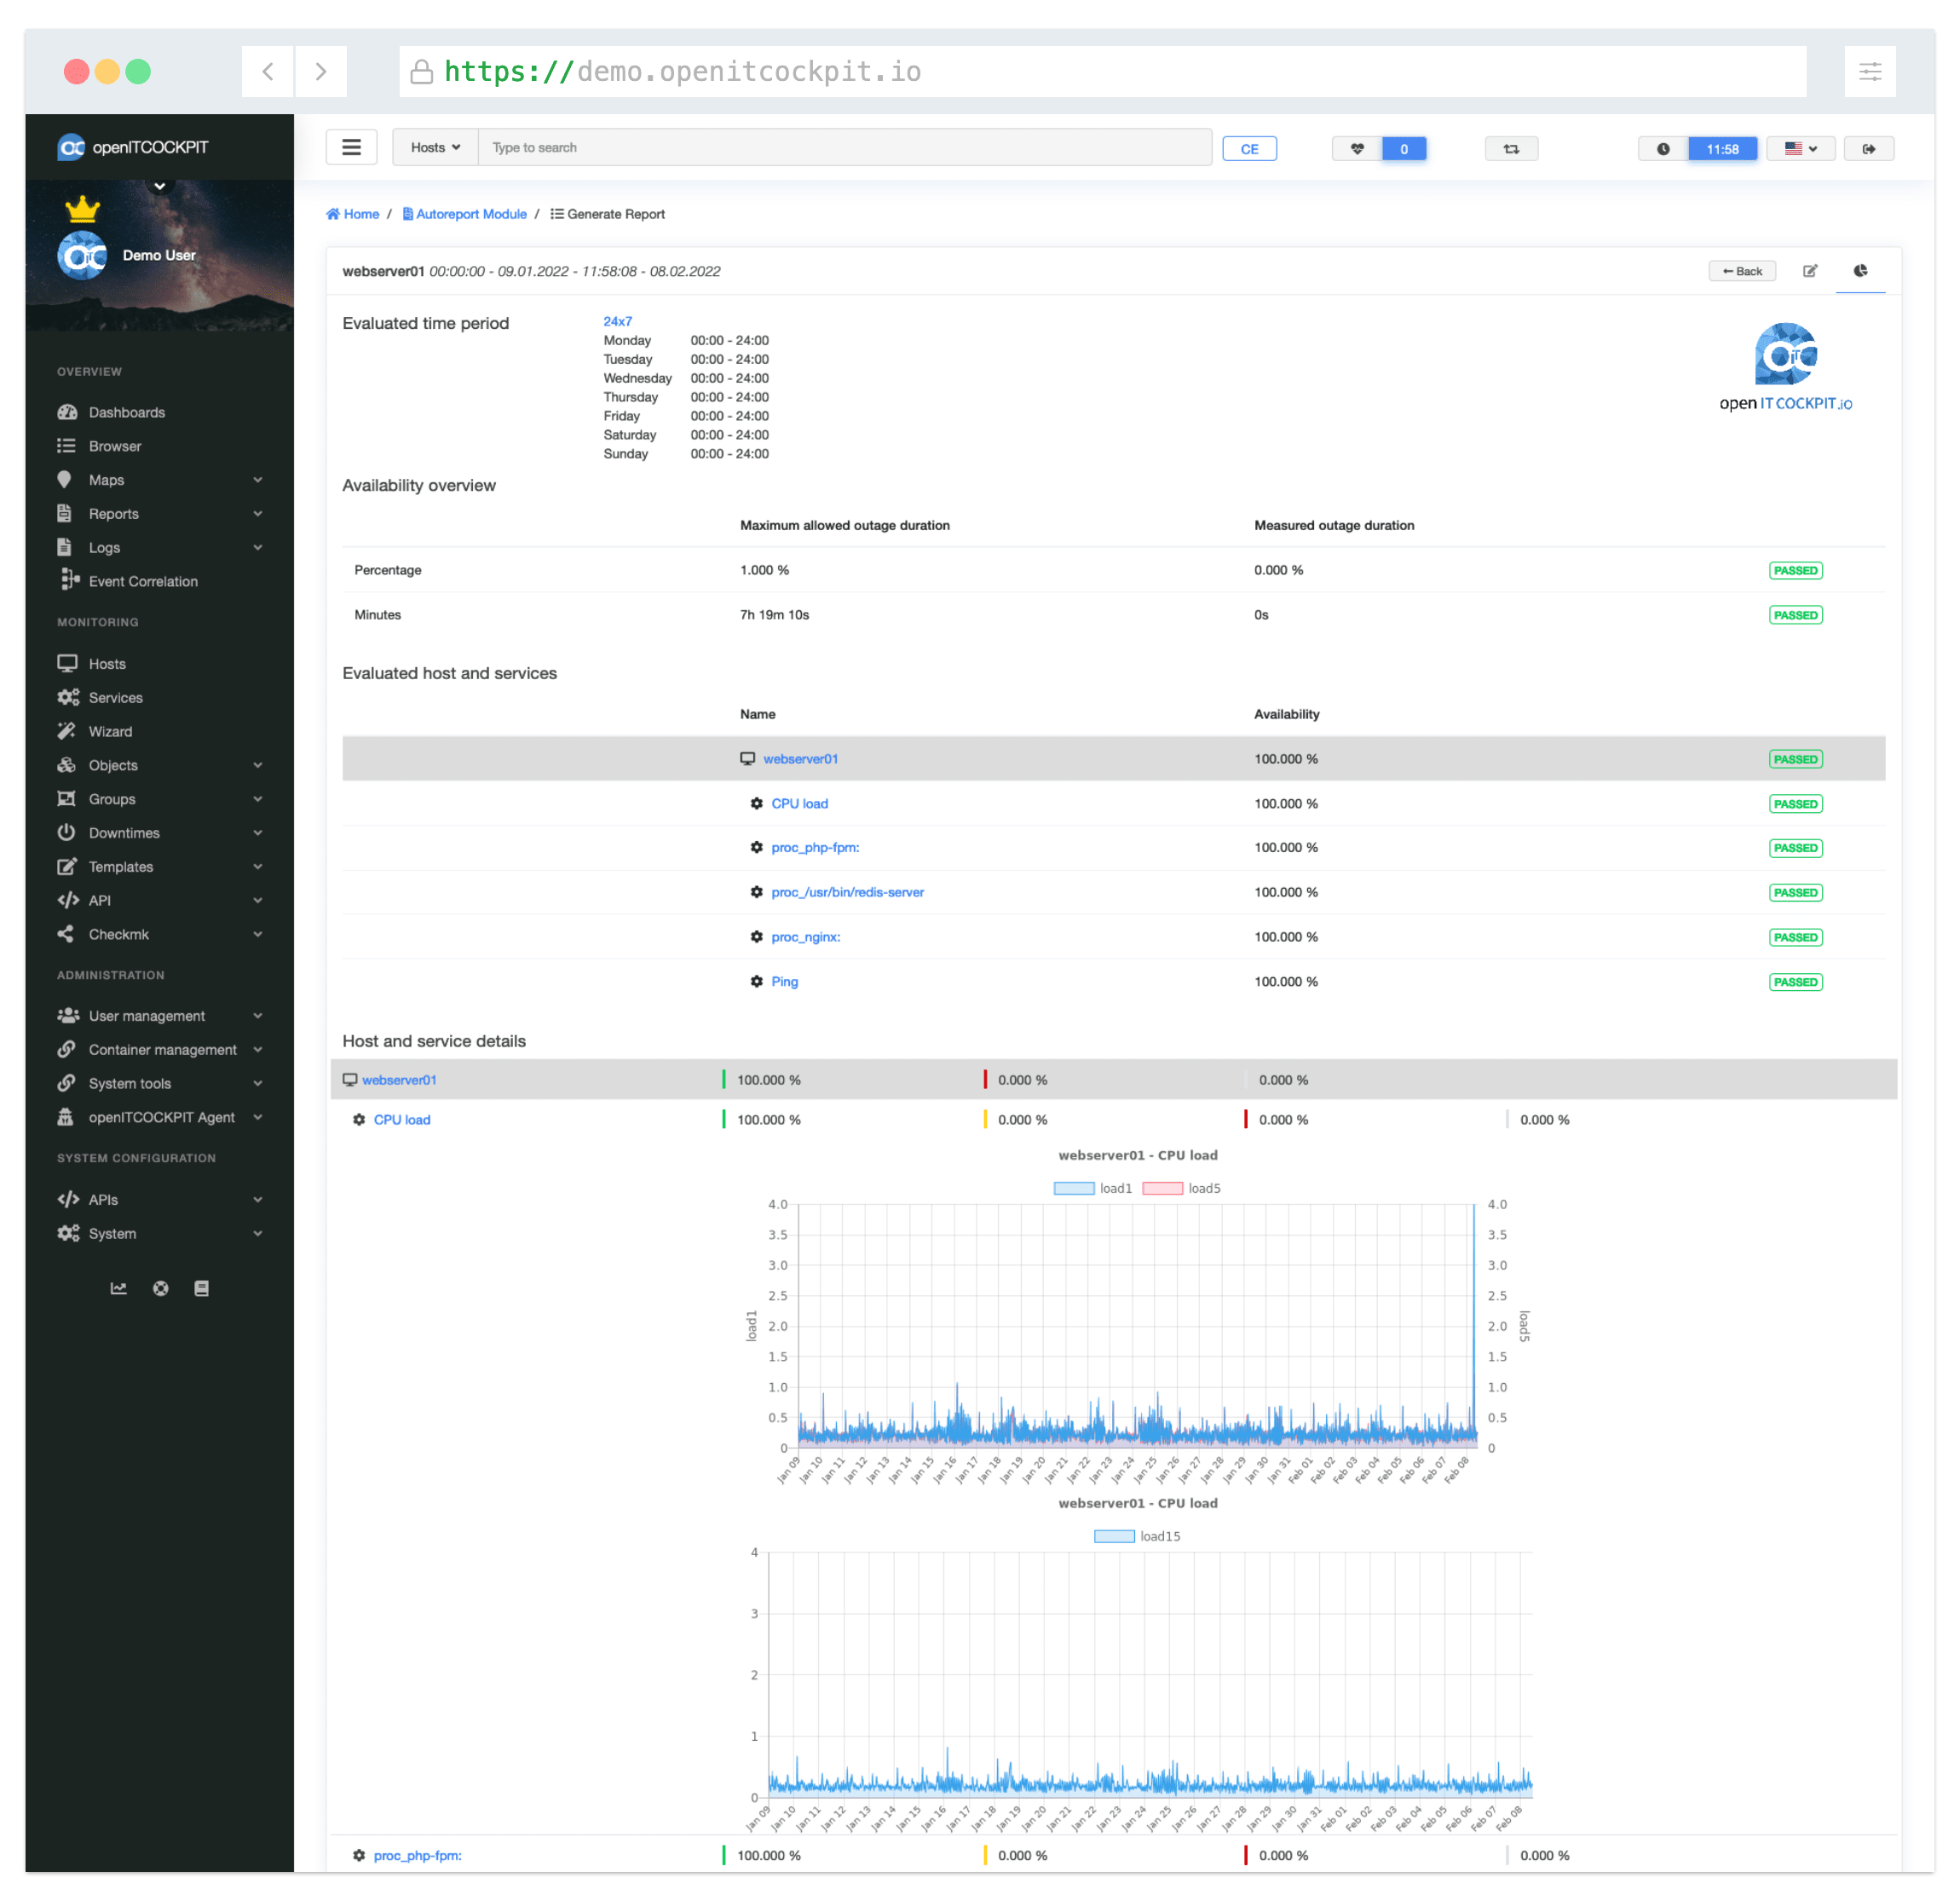
openITCOCKPIT provides different availability and SLA reports which can be generated manually or on a scheduled manner.
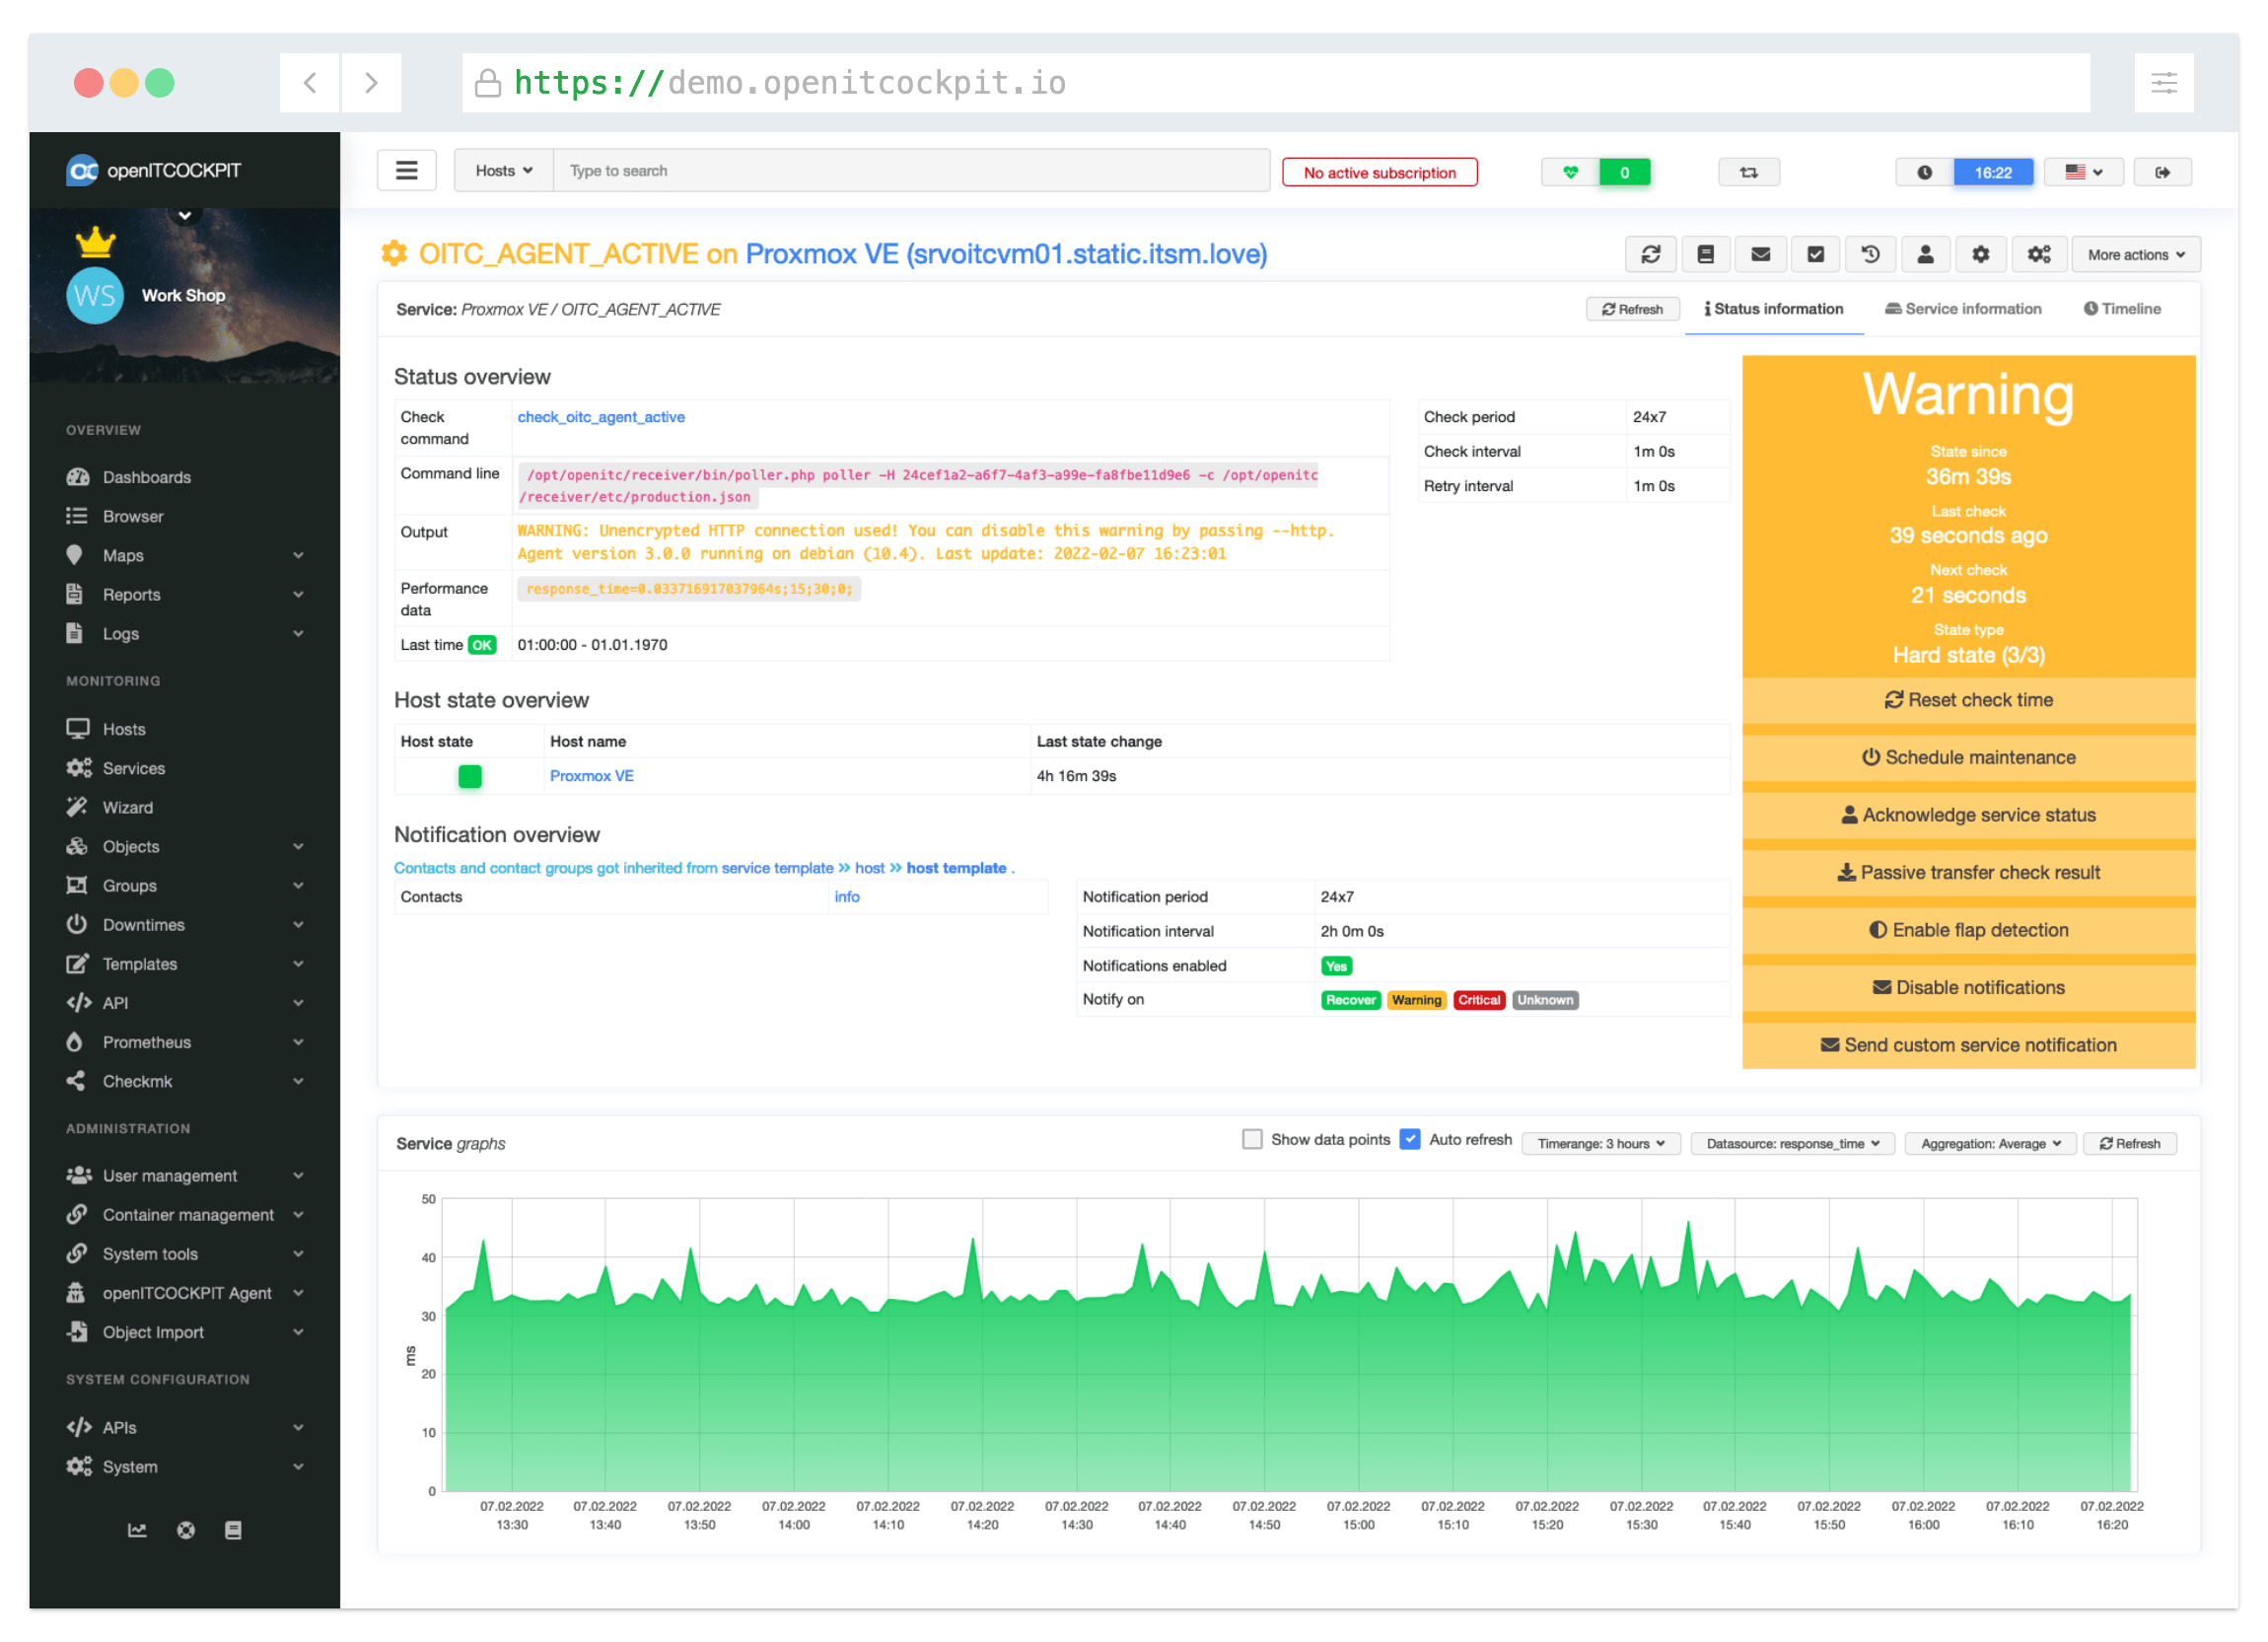
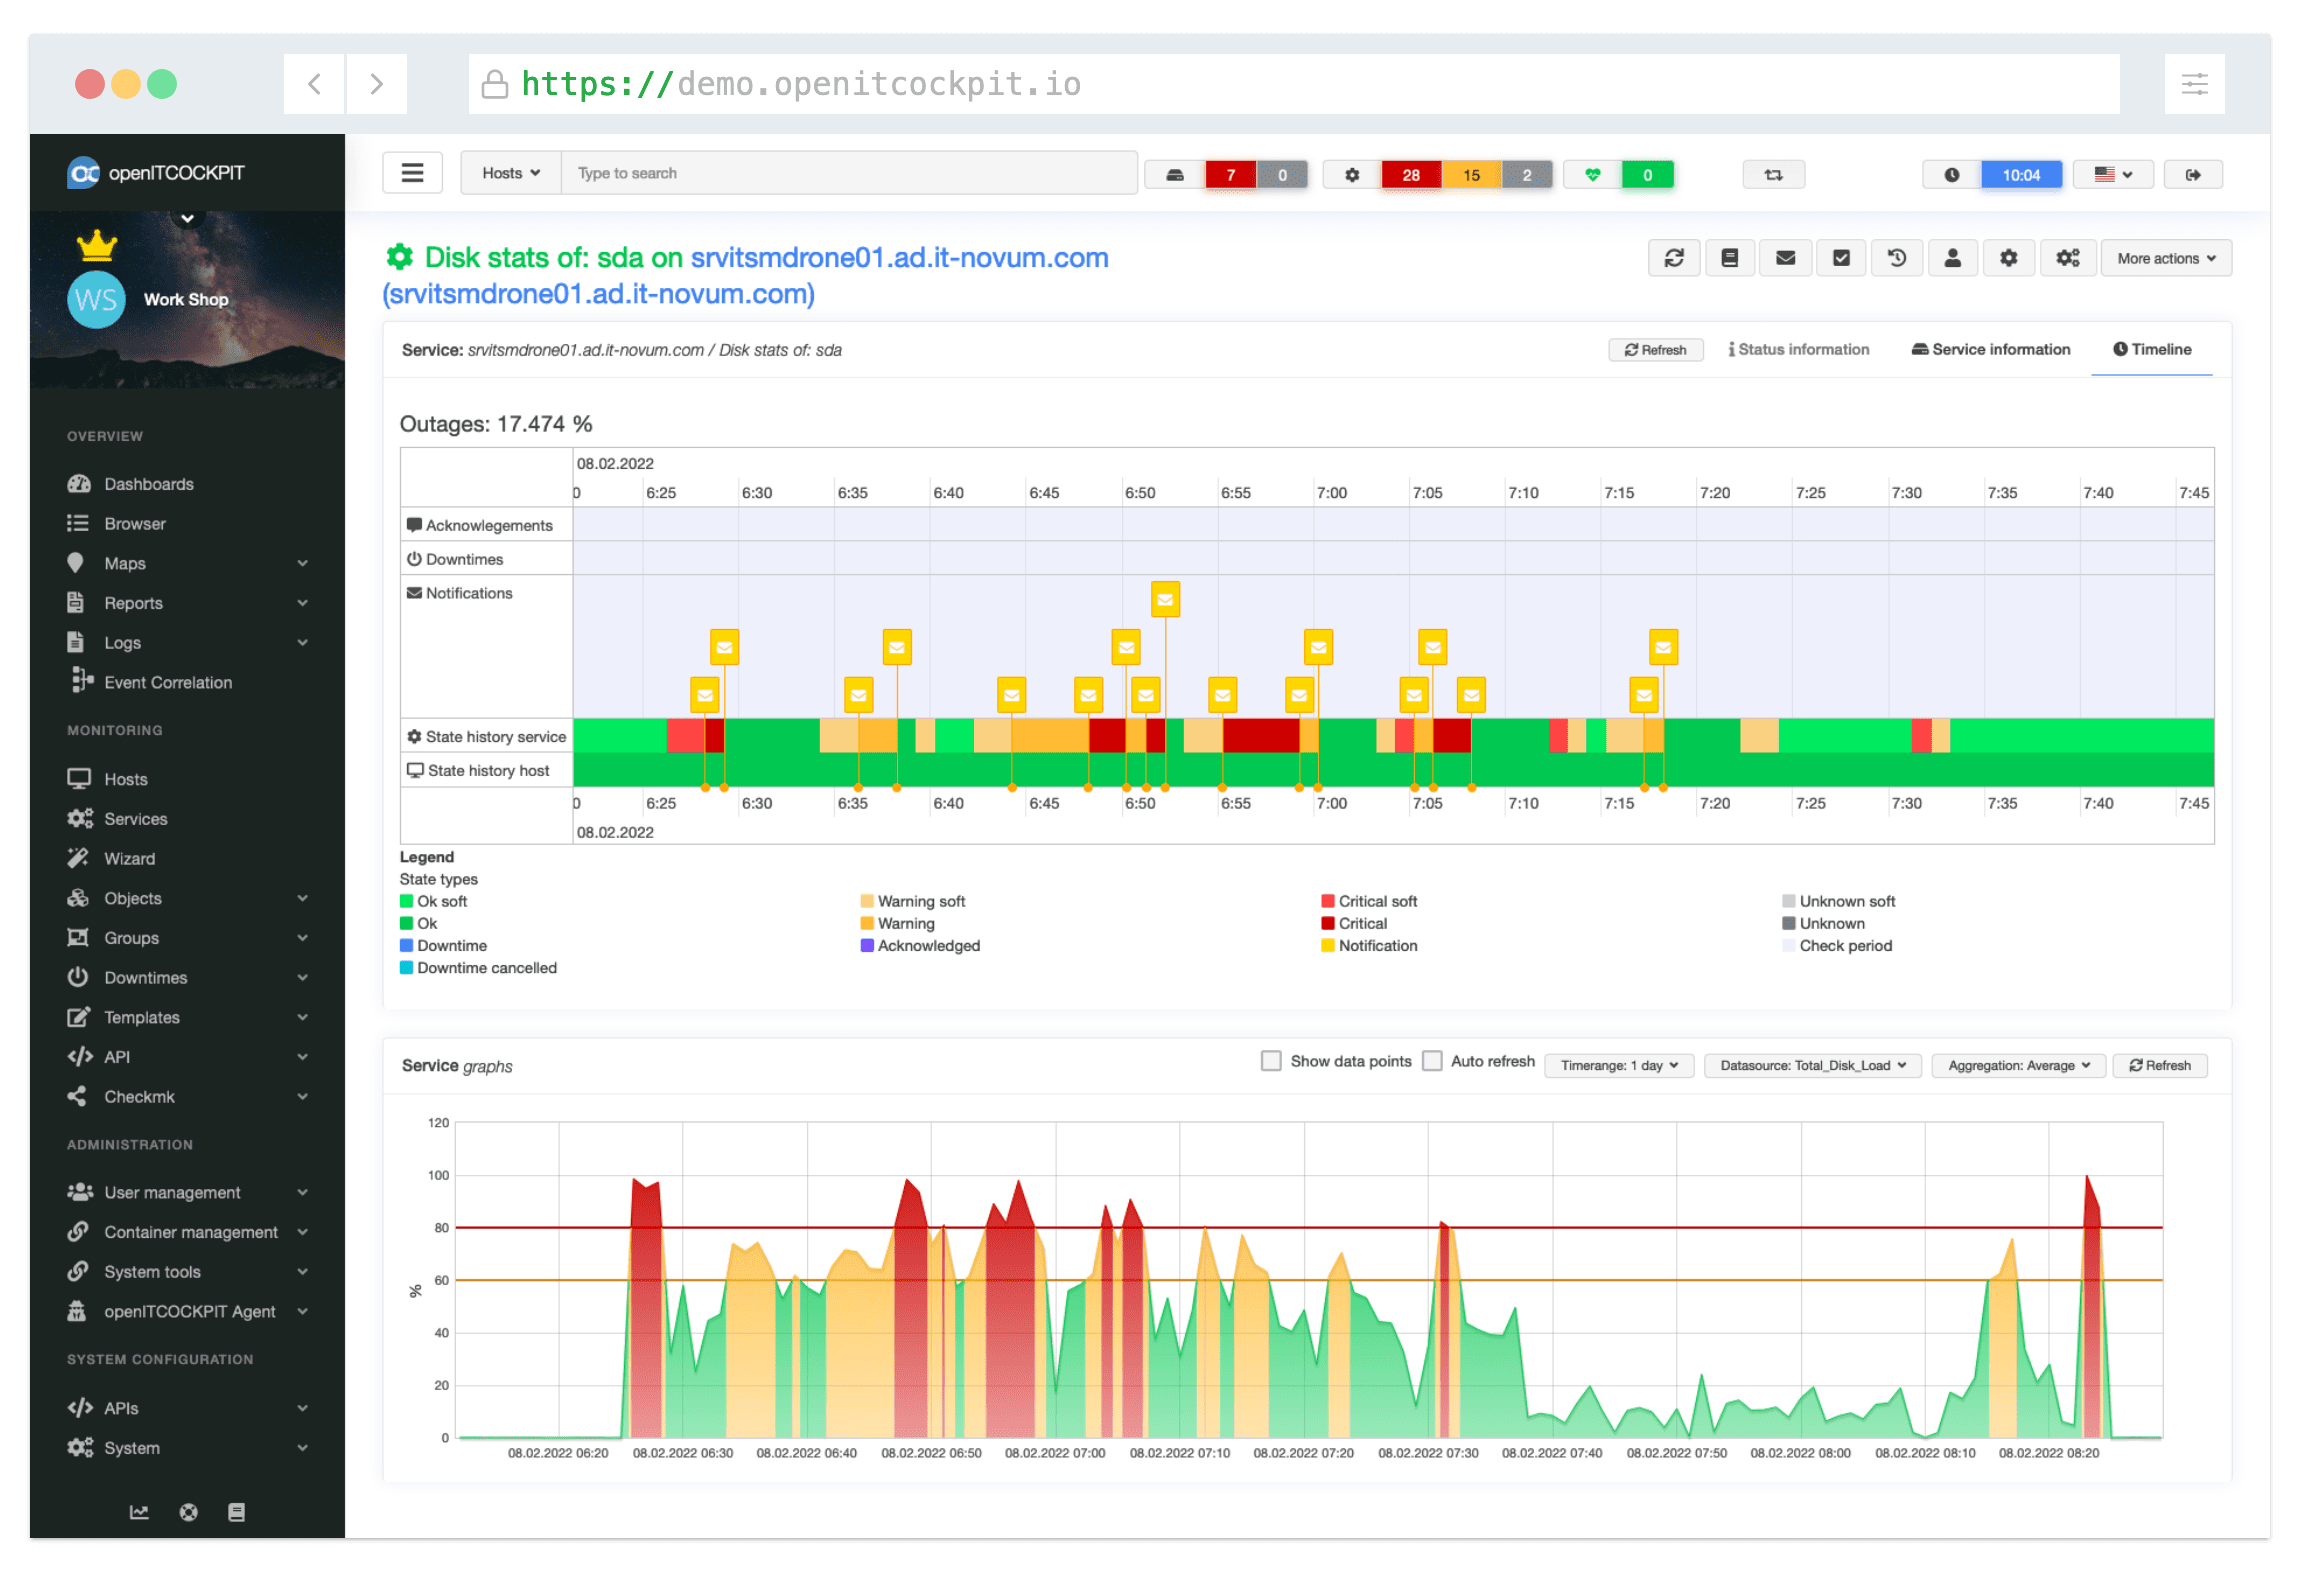
openITCOCKPIT keeps a history of all events for later analyses and reporting possibilities.
All events can be displayed in a timeline which visualize when which event got received and which action it triggered.
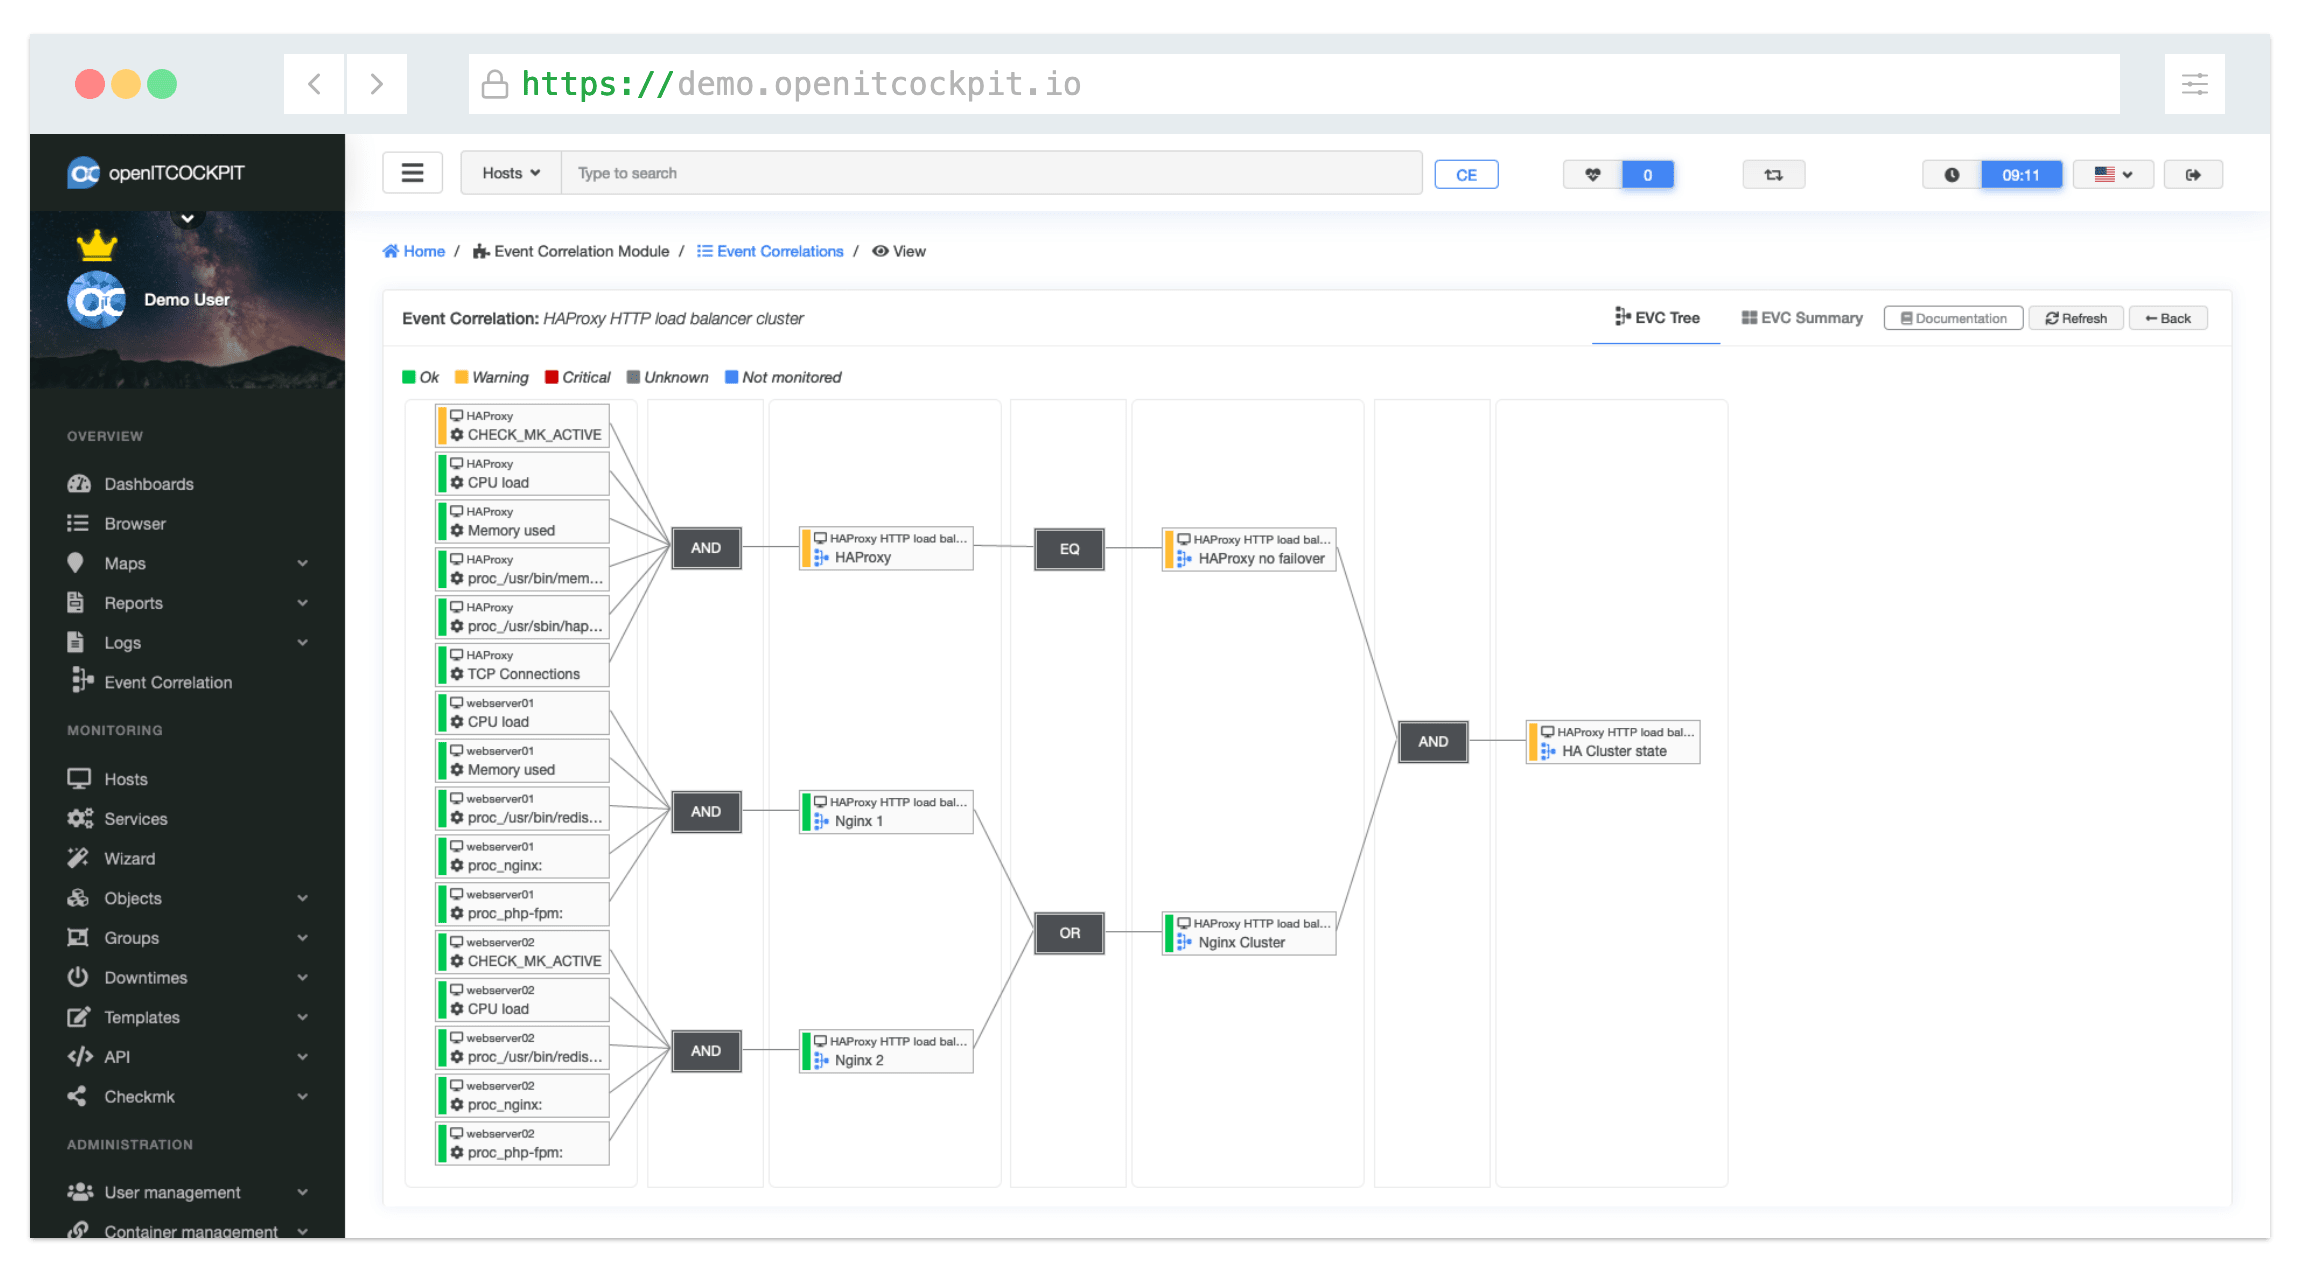
Correlate events to a business service, visualize of complex infrastructure and reduce the amount of alerts.
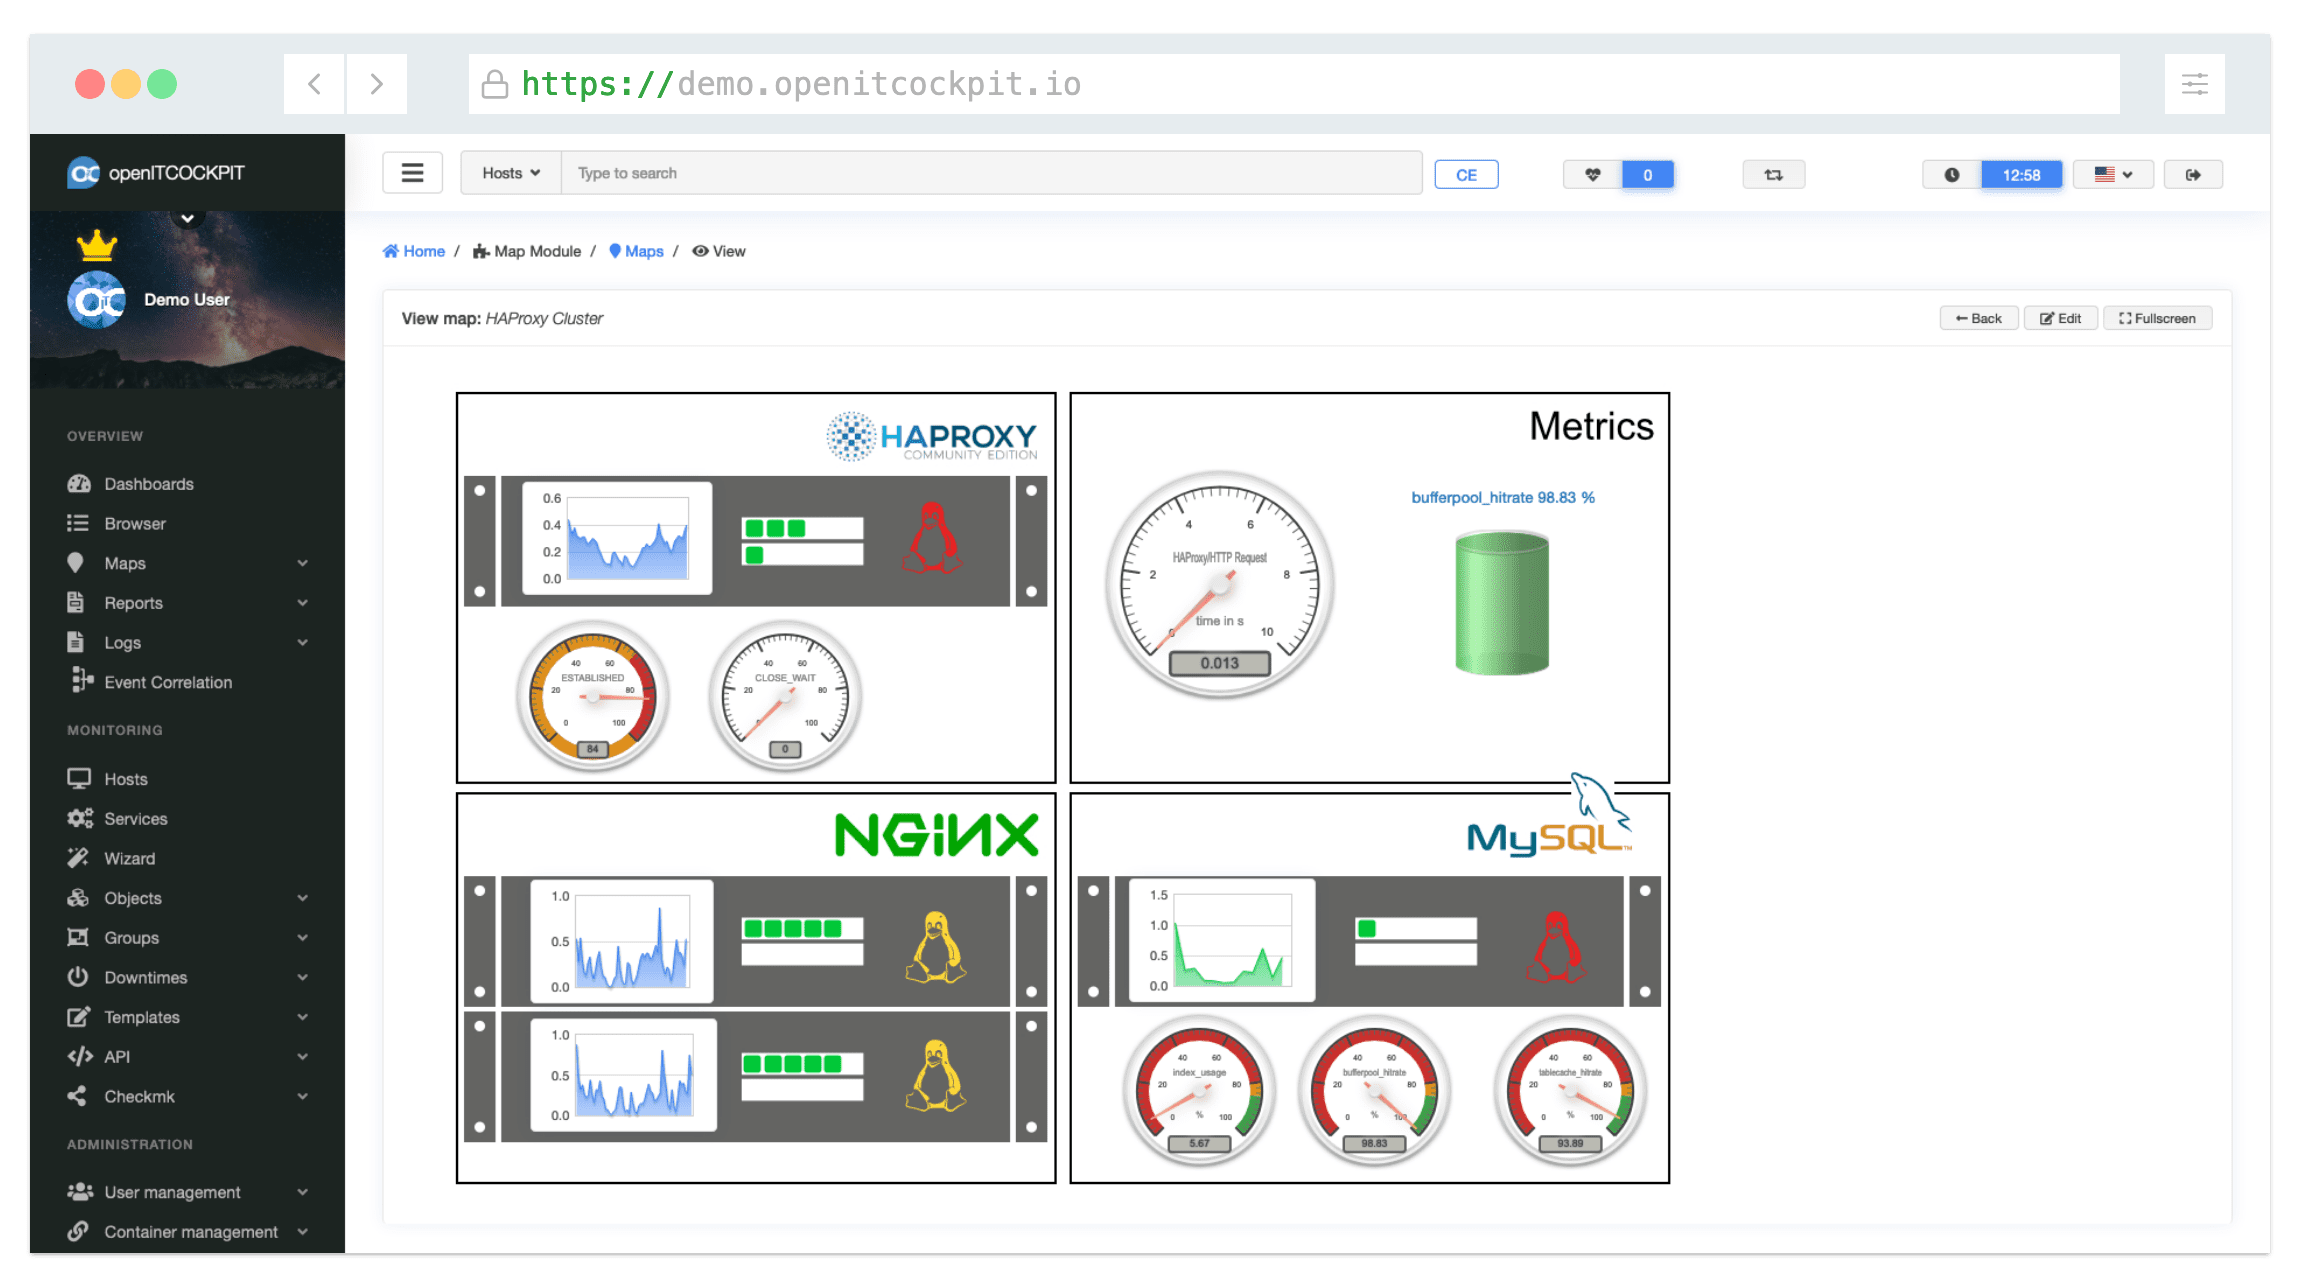
Create custom maps with our WYSIWYG map editor or keep everything tracked with our automatically generated status map.
openITCOCKPIT can be combined with different service management tools for monitoring, incident management and automated data imports from CMDBs or CSV files.


Every user of openITCOCKPIT can provide anonymous statistical data on a voluntary base (Opt-in). We use this data to optimize openITCOCKPIT and to get an overview about system sizes, most used openITCOCKPIT modules and operating systems.
Want to join? Learn how to enable anonymous statistics in your installation.
Installations
Services
Countries


Hello! I have been using openITCOCKPIT for a couple of months and i love it. I'm moving from Nagios Core[...]
It is easy to install, easy to config, it has good UI and design, it has features at Package Manager such as, Grafana (build-in on the new update), event correlation and more. I hope more to come on this. If you had a problem or question, it has a chatroom on freenode Libera Chat and they really helpful and kind.
Hallo, als erstes möchte ich euch herzlich für das openITCOCKPIT danken. Ihr habt hier wirklich eine super Arbeit geleistet! Besser und einfacher geht es fast kaum.
New about IT monitoring from the experts behind openITCOCKPIT.


openITCOCKPIT iOS App has been released
openITCOCKPIT 5.6.1 released

openITCOCKPIT 5.6.0 released