openITCOCKPIT 5.4.0 released
20.02.2026
openITCOCKPIT version 5.4.0 has been released! This is the first release of 2026 and it comes packed with many new features, including Patch Management, improved Wizards, and numerous bug fixes. The Prometheus Module is now included in the openITCOCKPIT Community Edition and is available to everyone for free. 🚀
Software inventory and patch management
The new Patch Management feature allows you to keep track of installed software and the current patch status of your hosts. It provides a central place to manage and monitor patch status, helping you keep your systems up-to-date and secure.
The data is collected by the openITCOCKPIT Monitoring Agent, so no additional software is required on the monitored hosts. Data collection is available for Windows, macOS and Linux in both Pull and Push modes.
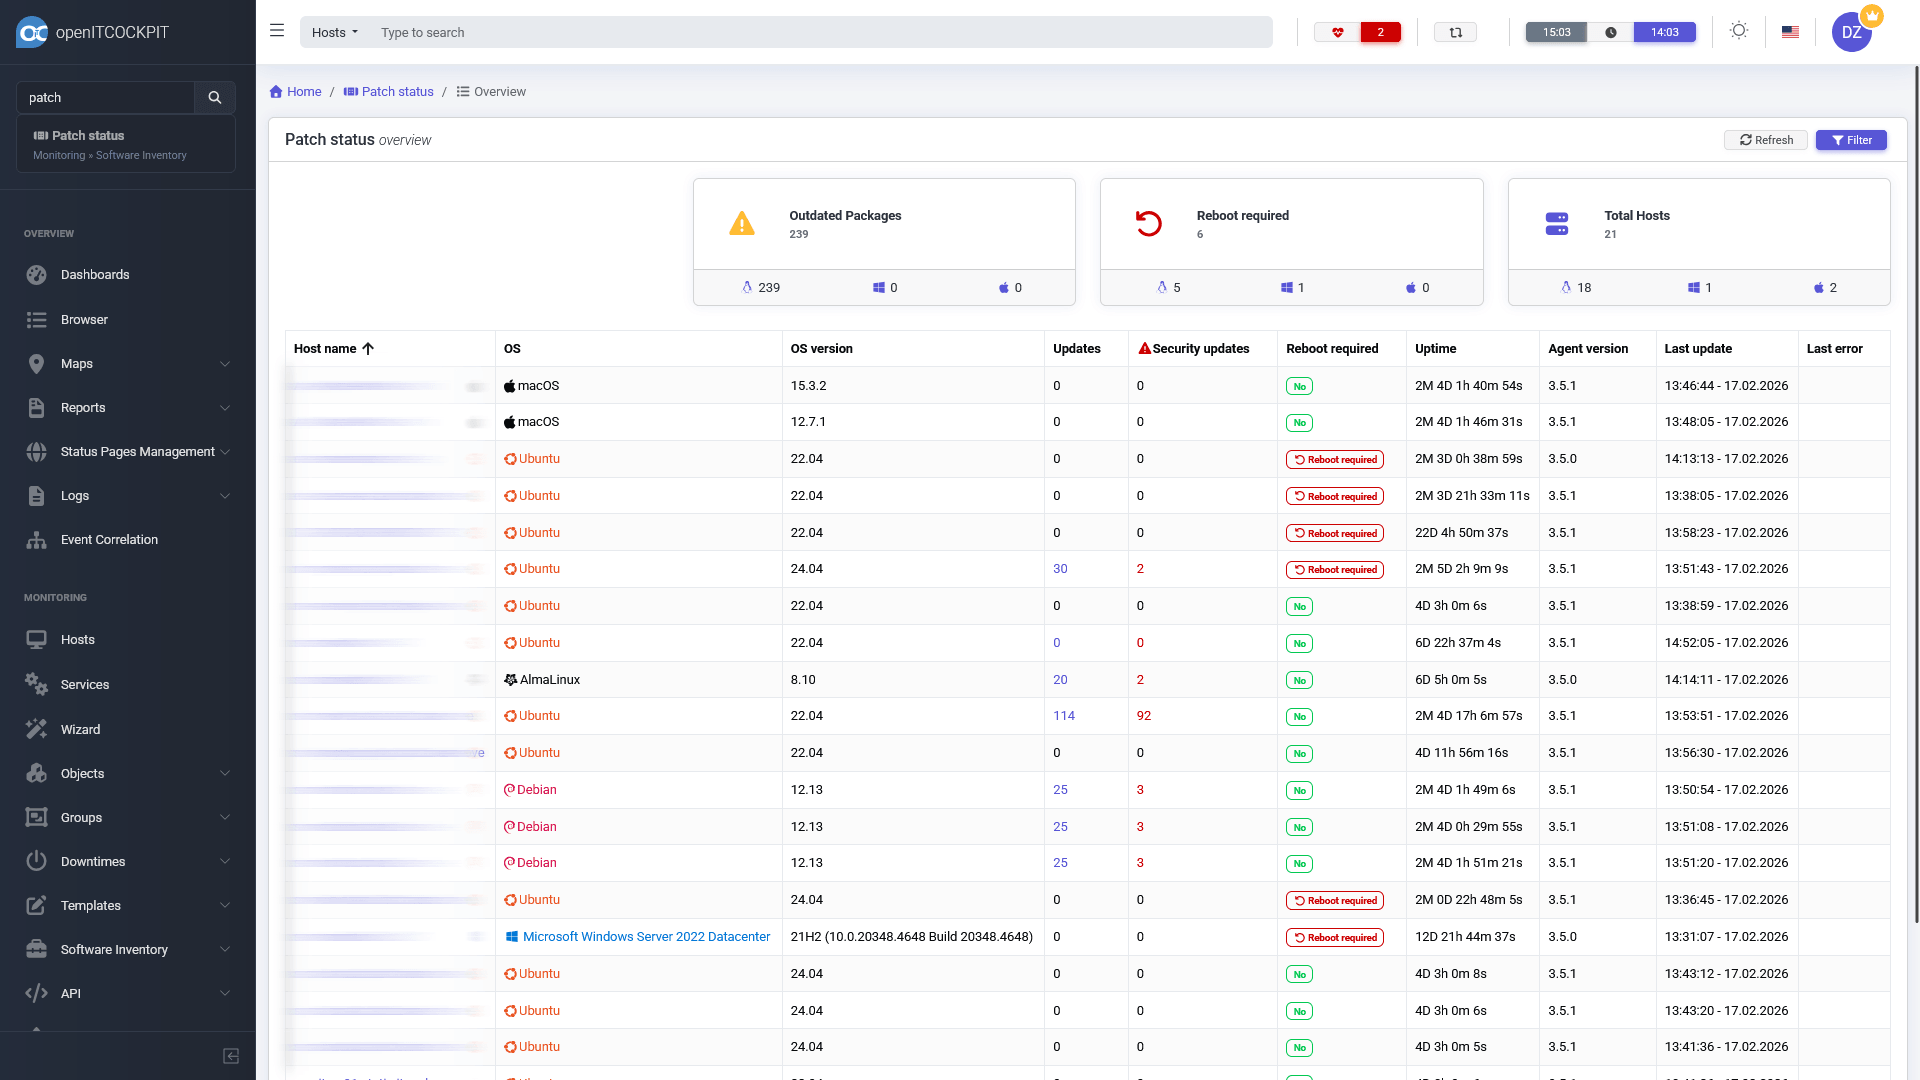
The Patch Status overview provides a list of all hosts, their operating systems, whether updates or security updates are available, if a reboot is required, the system uptime, and the last time the patch status was updated.
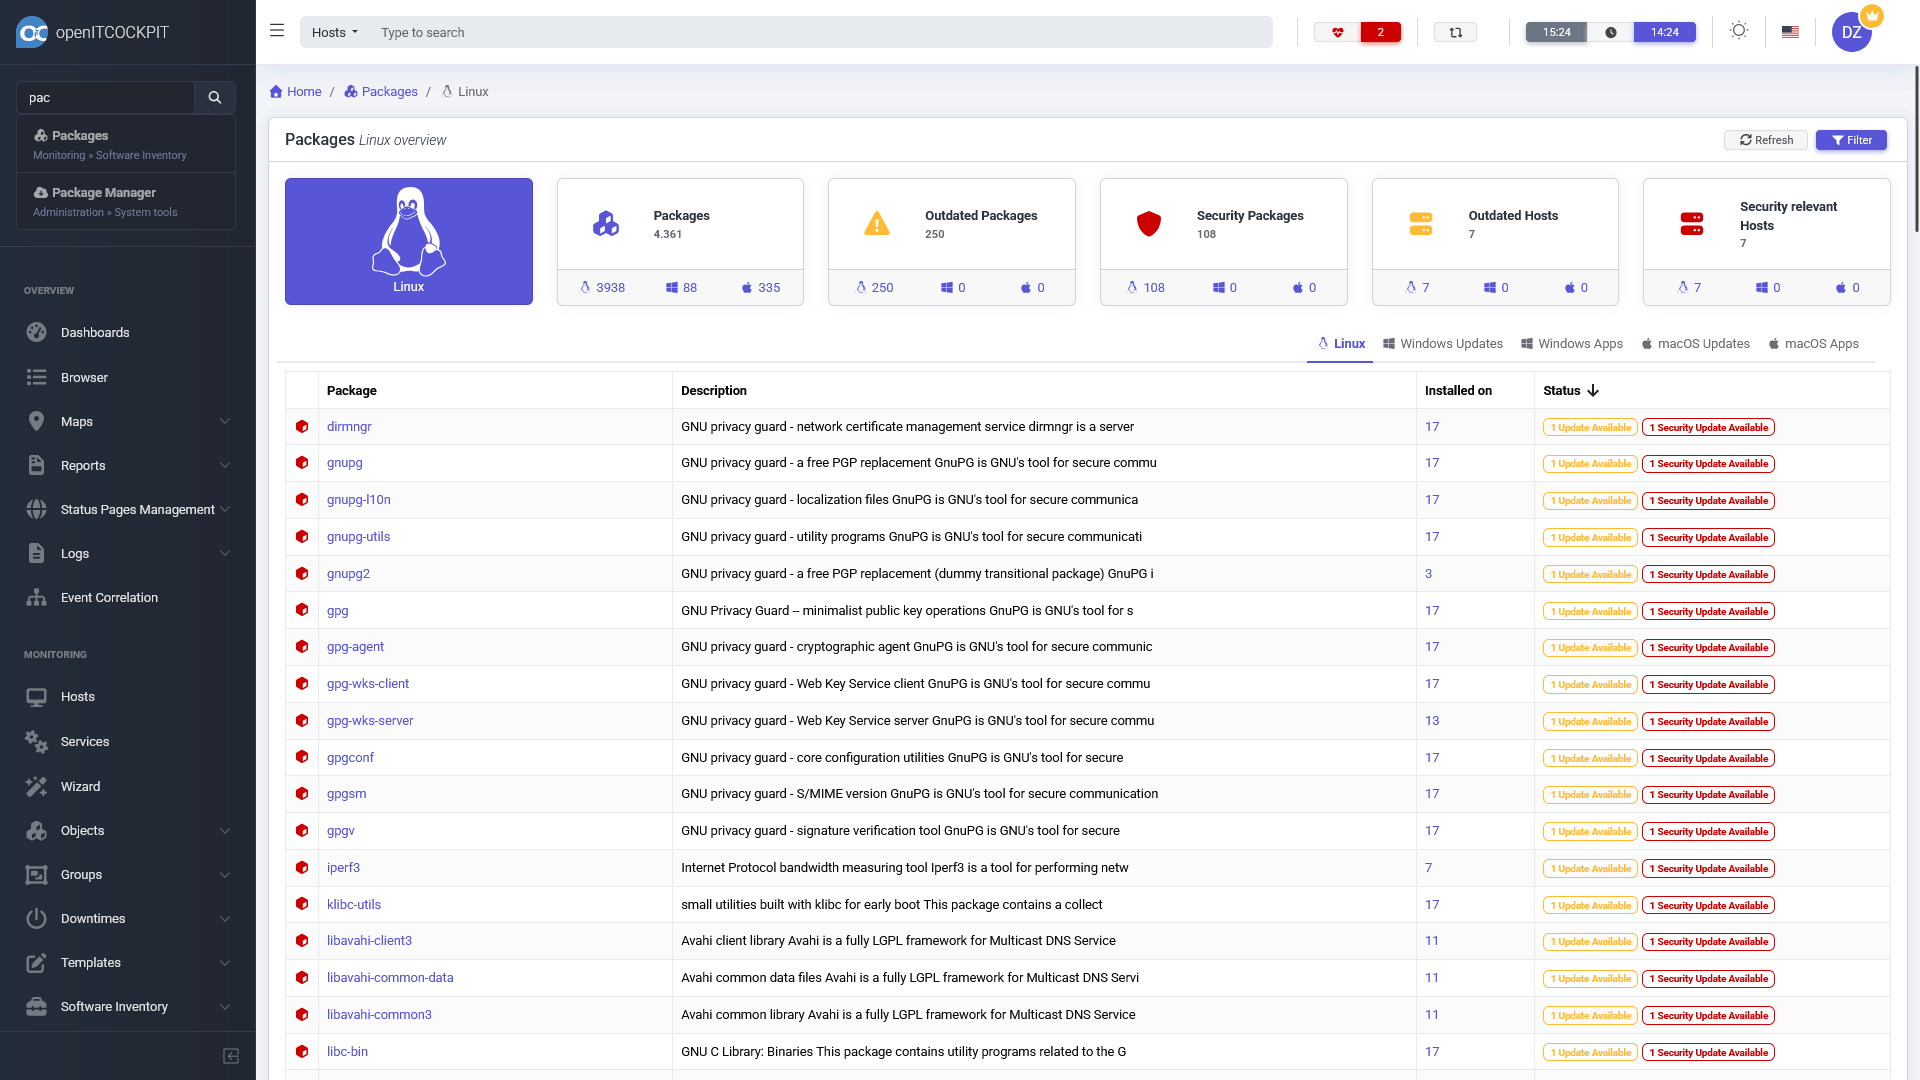
The Packages Overview shows all installed packages, whether updates are available, and on how many hosts each package is installed. For Windows and macOS, the section is split into Apps and Updates, as there is no package manager like on Linux.
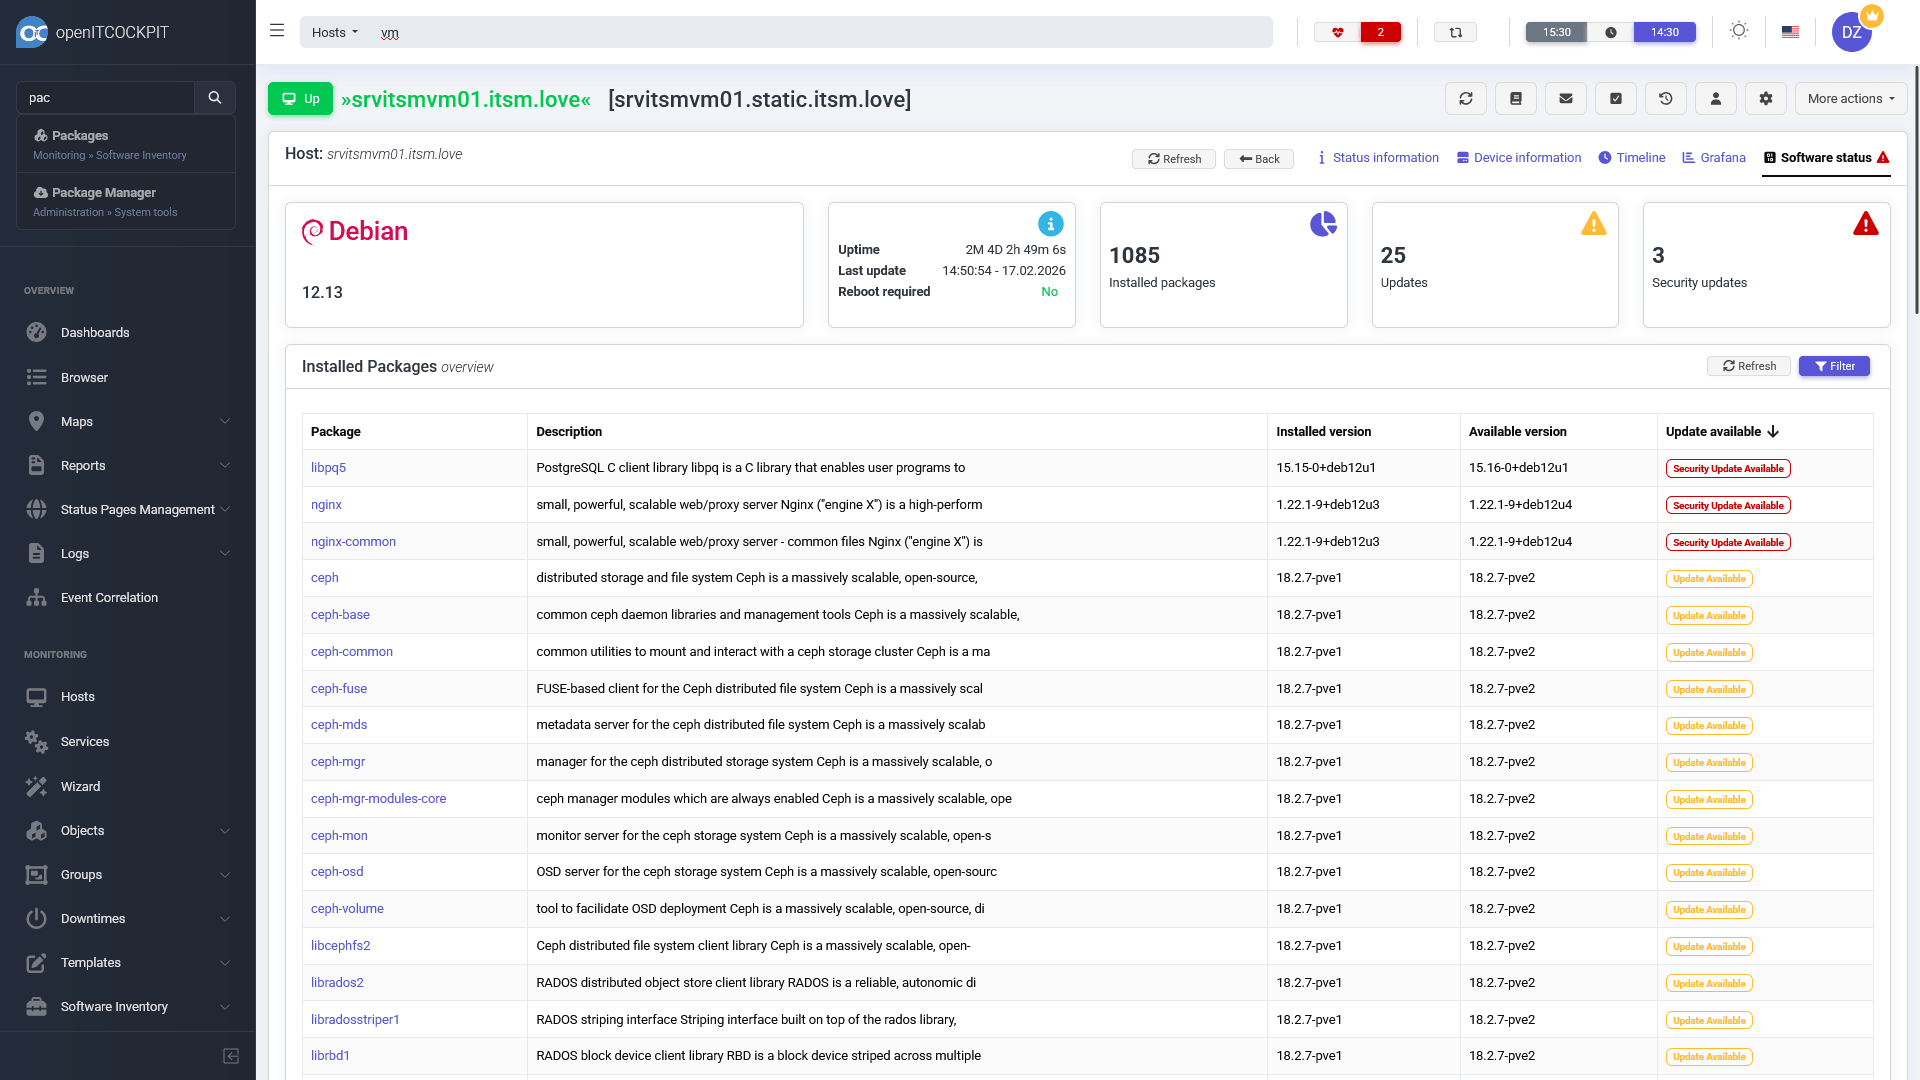
With the new System Updates check, openITCOCKPIT provides a unified way to monitor patch status. Additionally, the host details page now features a Software status tab, which shows the current patch status for each host.
Please see the official documentation for more information about the Patch Management.
Best of all, Patch Management is available for free in the openITCOCKPIT Community Edition! 🎉
The Prometheus Module is now part of the Community Edition

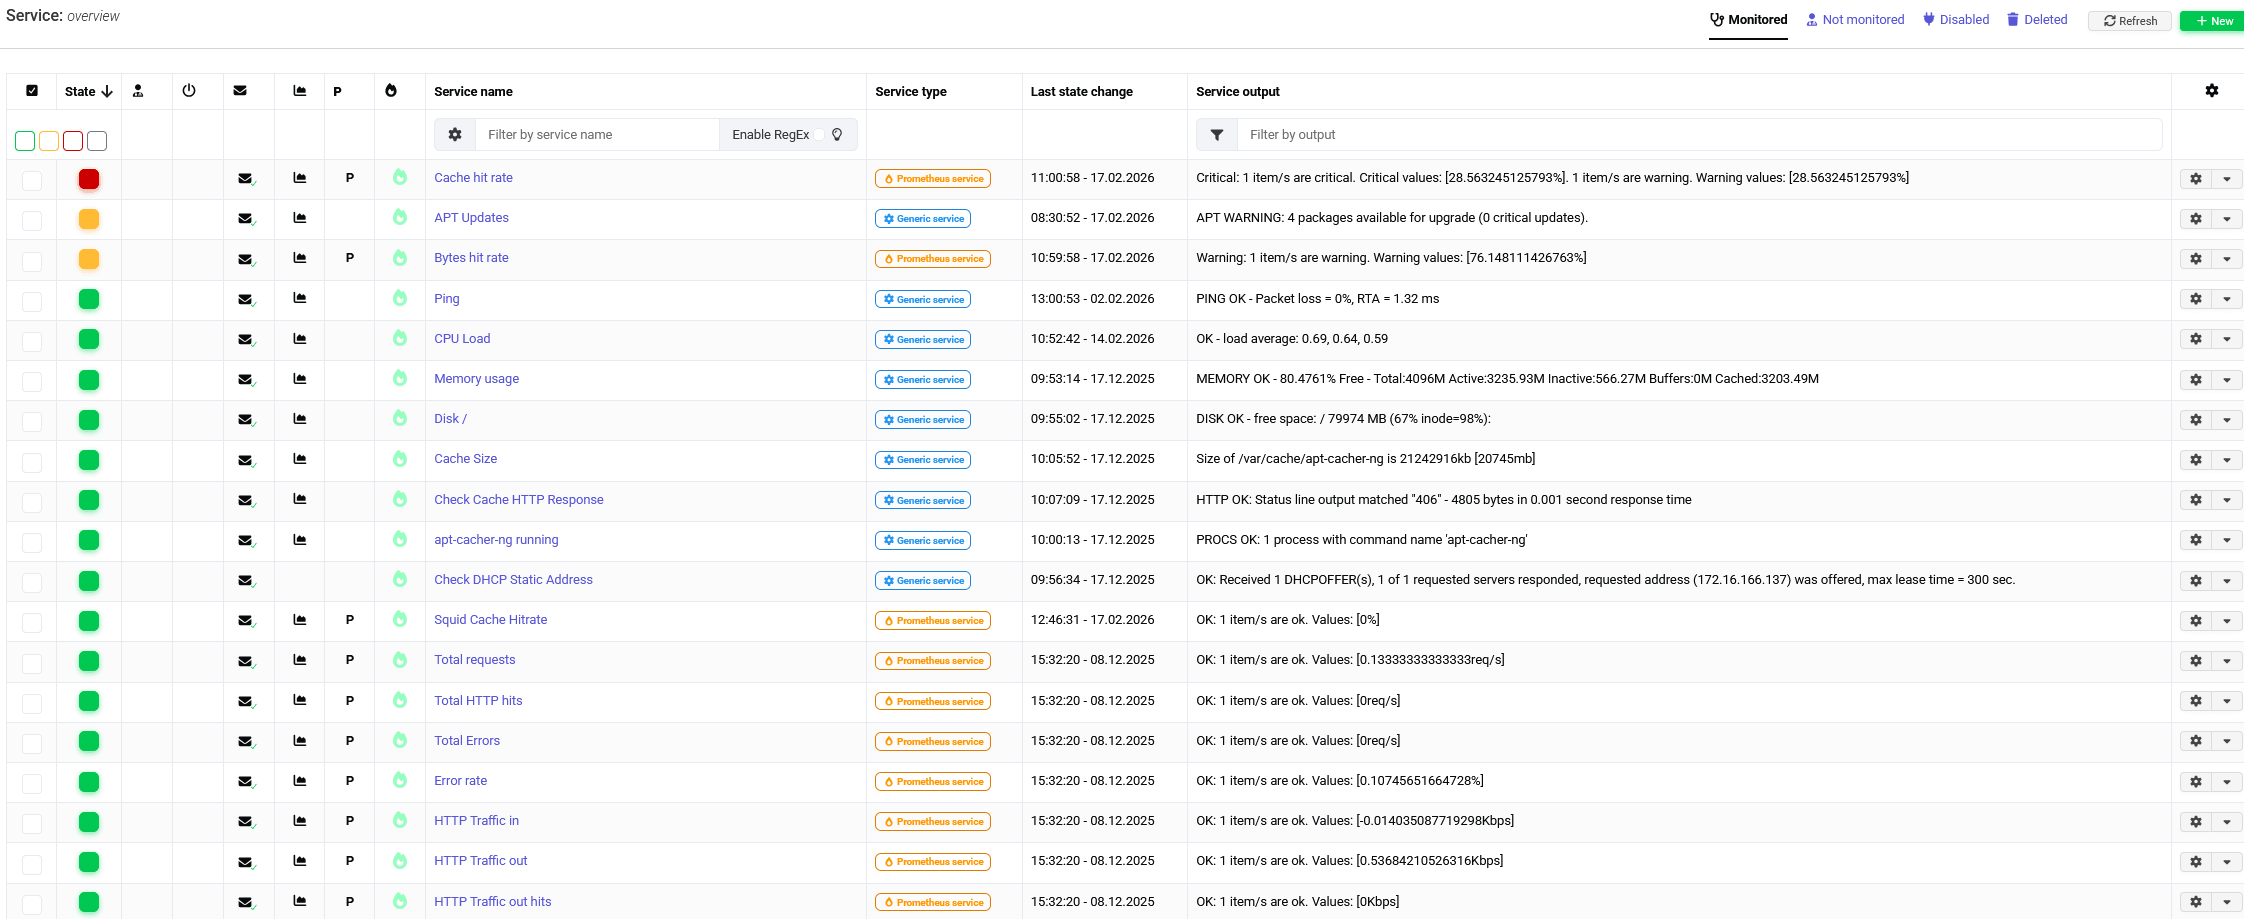
openITCOCKPIT has supported Prometheus since version 4.1.0, which was released five years ago. We are excited to announce that the Prometheus Module is now part of the openITCOCKPIT Community Edition. 🎉 This means you can now monitor your Prometheus targets and metrics with openITCOCKPIT. It is possible to mix and combine Prometheus with traditional monitoring checks and use all openITCOCKPIT features for your Prometheus monitoring, such as notifications, downtimes, acknowledgements, reports, dashboards, maps, and more.
Please see the official documentation for more information about the Prometheus Module.
Prometheus is awesome for collecting and storing a wide variety of metrics provided by exporters. There are hundreds of exporters available for all kinds of applications, databases, and hardware.
Did you know that openITCOCKPIT even provides a Prometheus Exporter so you can monitor the monitoring? But wait, there’s more! The openITCOCKPIT Monitoring Agent can also be used as a reverse proxy for Prometheus exports, similar to the Exporter Exporter. In this case, openITCOCKPIT will handle authentication and encryption, and only a connection on port 3333 is required.
Microsoft Teams Incoming Webhook End of Life on March 31st
The Microsoft Teams Incoming Webhook feature will reach end of life on March 31st.
We’re following the recommendations outlined in the Microsoft Developer Blog
by switching to Power Automate.
Please see the official documentation for how to set up Microsoft Teams notifications.
System information about Satellites
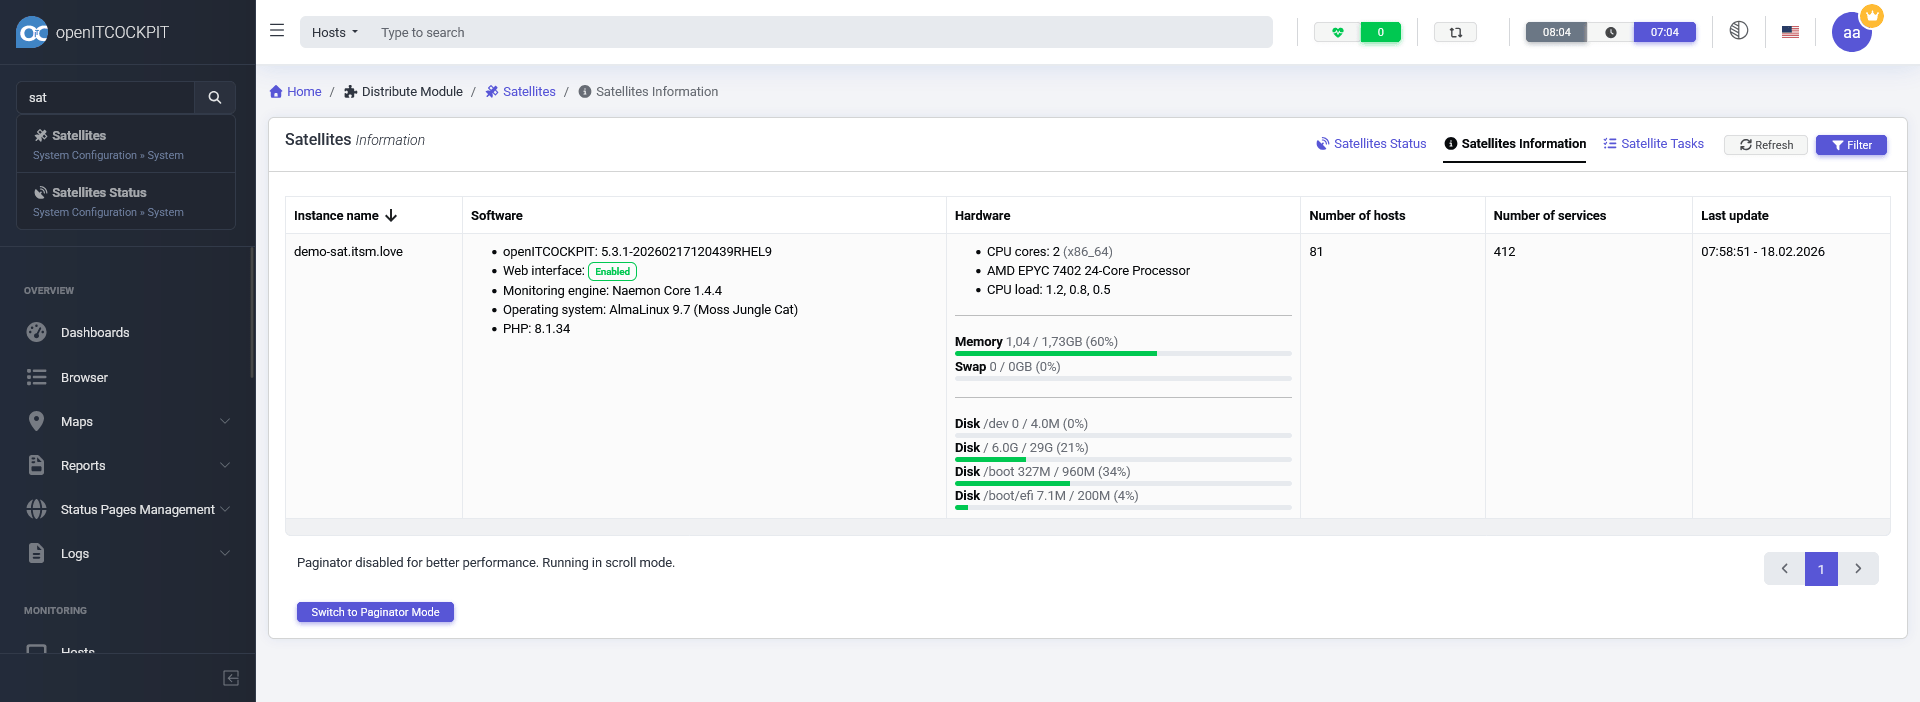
With distributed monitoring, you can have multiple Satellites that collect monitoring data and send it to the Main Server. This can be useful to monitor remote locations, or to distribute the monitoring load across multiple servers.
In openITCOCKPIT 5.4.0, we have added a new section to the Satellite Status page that shows system information about the Satellite itself, such the openITCOCKPIT version, the operating system, CPU -, memory - and disk usage and more.
Updated Wizards
Proxmox VE
We have made some minor improvements and bug fixes to the Proxmox VE monitoring. Additionally, we have reorganized the packages that provide our check plugins for the Wizards.
All community plugins are now provided by the package openitcockpit-community-plugins. You do not need to take any action—
the package manager will automatically update the packages and install the new plugins.
For more information about the Proxmox Wizard, please see our last blog post.
New Wizards
We have also added a number of new Wizards:
- Apache Status & Tomcat
- NetApp
- NGINX Status
- Fortigate Firewall
- Palo Alto Firewall
- Fujitsu Eternus Tape Library
- Citrix Netscaler
- Aruba Network
For a quick overview of the available metrics openITCOCKPIT can monitor, please see our metrics page.
Security fixes
The GitHub User h00die-gr3y reported several security vulnerabilities in openITCOCKPIT, which we have fixed in this release. We would like to thank h00die-gr3y for responsibly disclosing these issues to us.
- CVE-2026-24891 Security: Unsafe PHP Deserialization in Gearman Worker Allows Conditional Object Injection
- CVE-2026-24892 Security: Unsafe Deserialization in openITCOCKPIT Changelog Handling
Both vulnerabilities are related to unsafe deserialization in the Gearman Worker and the Changelog handling via php’s unserialize() function. The vulnerabilities could potentially allow an attacker to execute arbitrary code on the server if they can control the input to the deserialization process.
Update to Angular 21
We have updated the Angular version of all openITCOCKPIT applications to Angular 21. This update is part of our commitment to keep the underlying technologies of openITCOCKPIT up-to-date.
Docker Users: Grafana Update for Prometheus
If you are using the Docker version of openITCOCKPIT, a manual change is required. The old Grafana configuration has to be replaced with a new one. openITCOCKPIT will do all the configuration for you, but you have to delete the old Grafana volume first.
- 1 Stop the openITCOCKPIT Docker Compose stack.
- 2 Update to the latest version of openITCOCKPIT by pulling the latest Docker images.
- 3 Apply the changes to your
compose.ymlandopenitcockpit.envfile. - 4 Delete the old Grafana volume. You can do this by running the following commands:
# check if the stopped Grafana container still exists and remove it
$ docker container ps -a |grep grafana
ba3cefef9211   openitcockpit/grafana:nightly               "/run.sh"                12 minutes ago   Exited (0) About a minute ago               openitcockpit-ce-docker-grafana-1

# remove the old Grafana container
$ docker container rm ba3cefef9211

# remove the old Grafana volume
$ docker volume ls | grep grafana
local     openitcockpit-ce-docker_grafana-data

$ docker volume rm openitcockpit-ce-docker_grafana-data
- 5 Start the openITCOCKPIT Docker Compose stack again.
$ docker compose up -d
None of your existing Grafana dashboards will be lost. openITCOCKPIT has a cronjob which will restore all dashboards. You can also execute this manually by running the command oitc cronjobs -f in the openitcockpit-ce container.
In case you already have updated openITCOCKPIT to 5.4.0 but have not deleted the old Grafana volume, you can still do this now. Just stop the Docker Compose stack, delete the old Grafana volume, and start the stack again. Otherwise your Grafana may not display Prometheus metrics properly.
Changelog
For a complete list of new features, bug fixes, and improvements, please see the changelog.
How to Update
Please see the official documentation for instructions on how to update openITCOCKPIT.
Your openITCOCKPIT Team