openITCOCKPIT 4.1 with Prometheus integration
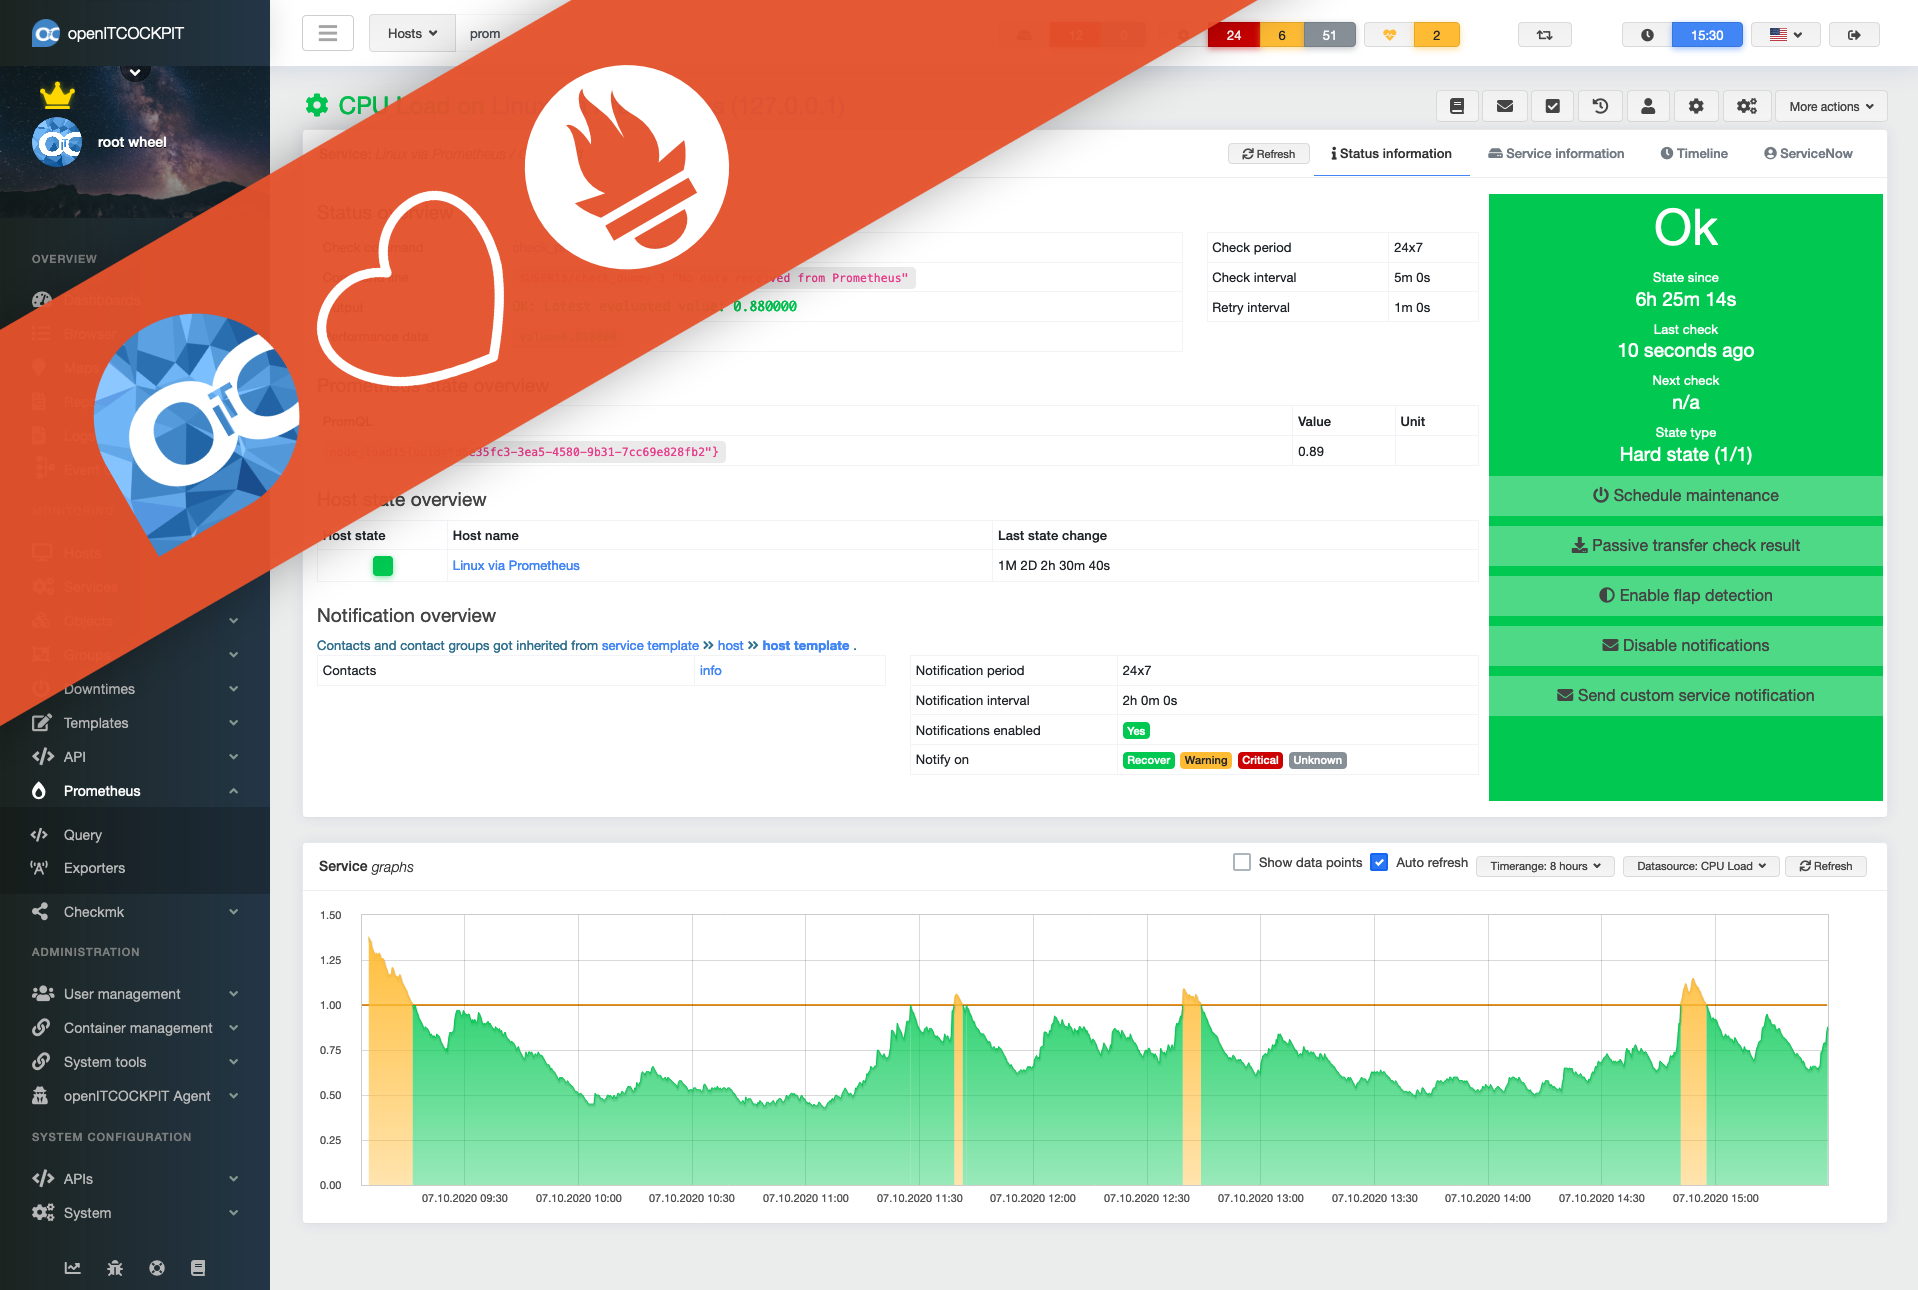
openITCOCKPIT welcomes Prometheus as the newest member to our monitoring family. IT infrastructure has so many facets from bare metal to containers over switches and routers to Industry 4.0. As times are changing also the monitoring system has to evolve. Our goal was a seamlessly integration of Prometheus into openITCOCKPIT.
All openITCOCKPIT features you are used to are also available for Prometheus monitored services. Autoreports, event correlations, Grafana dashboards, usage of the same contacts, scheduled downtimes and acknowledge issues - all this is possible.
Most of the time you will not notice which monitoring engine gets used in the backend.
New ways - known concepts
Prometheus is a metrics based monitoring system. Instead of executing plugins and checking for return codes like Nagios or Naemon does, Prometheus focus on collecting metrics at a high frequency.
So called exporters running on the target devices provide a HTTP webserver to expose the metrics for Prometheus. Exporters can be compared to classic monitoring agents like NSClient++, NRPE or the openITCOCKPIT Monitoring Agent. But exporters don’t have to be a separate program running in the background. Also applications can be a target for Prometheus directly. So instead of writing a check plugin which tries to detect the health state of an application, the application itself can export the health state via a HTTP endpoint.
The Prometheus daemon running on the openITCOCKPIT server scrape the target devices via an HTTP connection to fetch the latest metrics.
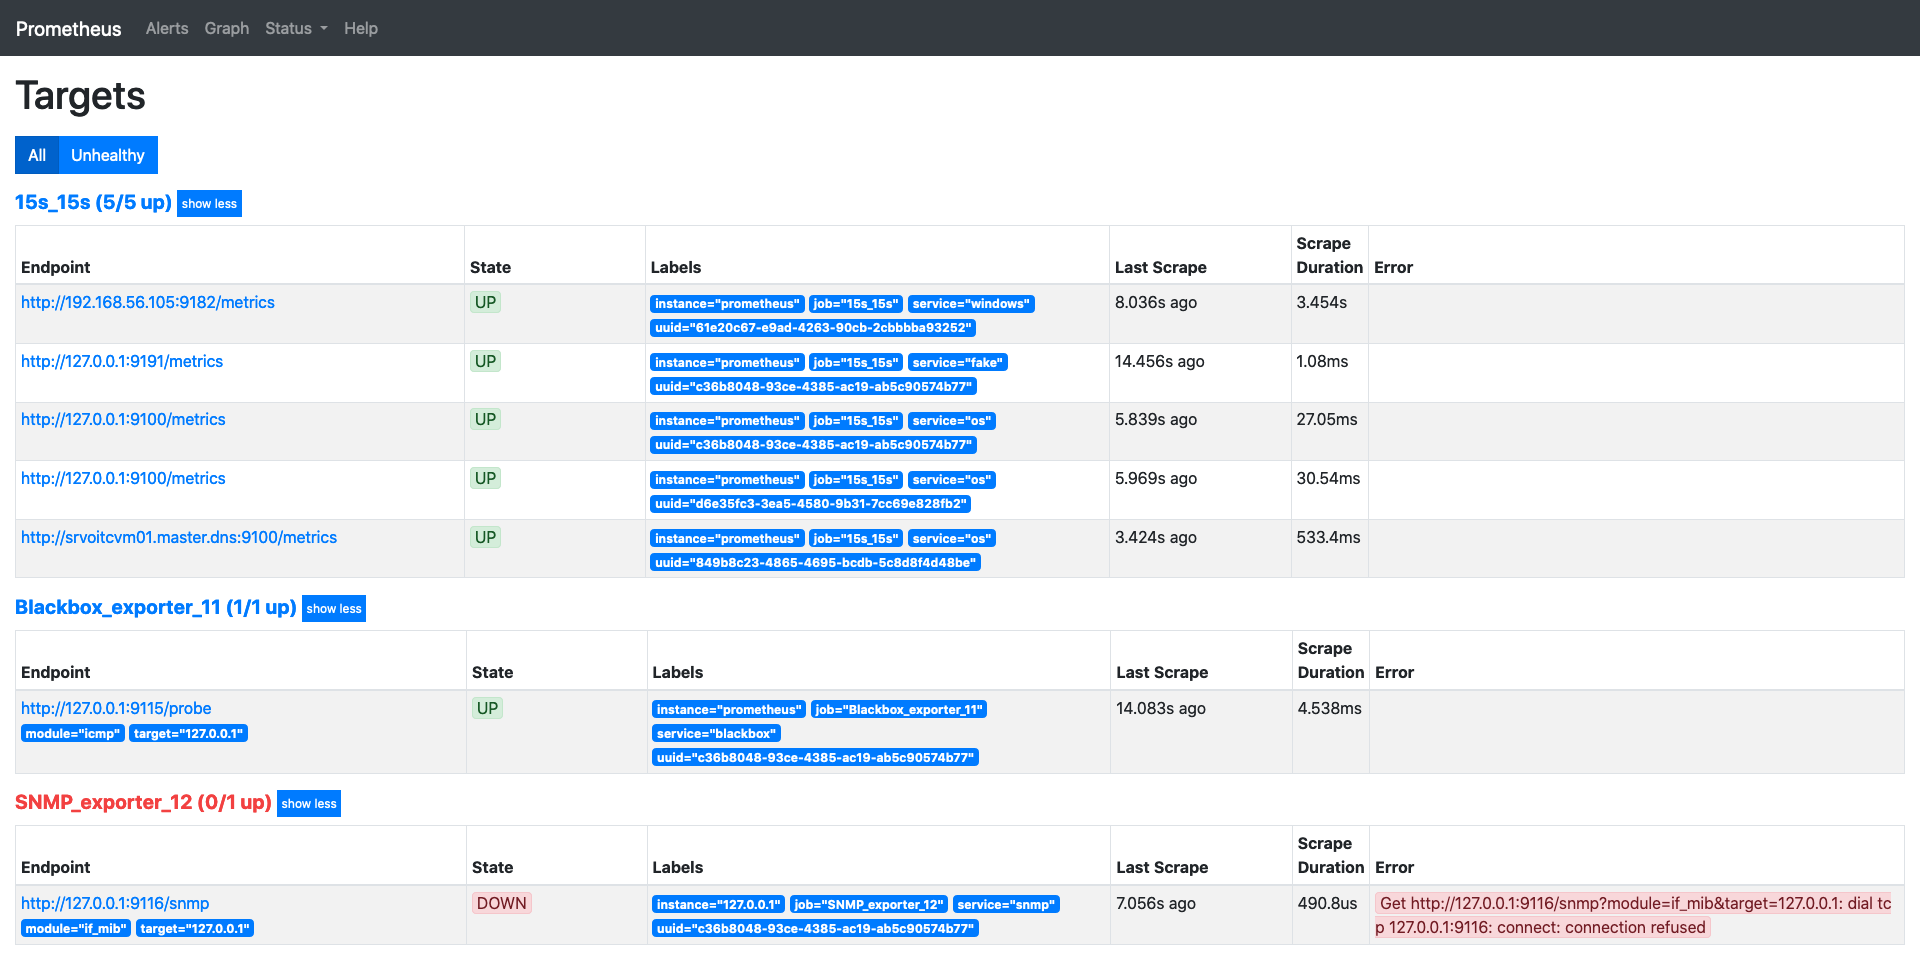
As mentioned above Prometheus got seamlessly integrated into openITCOCKPIT. More about the integration will be shown later in this post. Nevertheless we wanted to show you how Prometheus targets would look like in the original web UI.
As you can see, every target gets queried through a HTTP request.
Managing exporters and targets
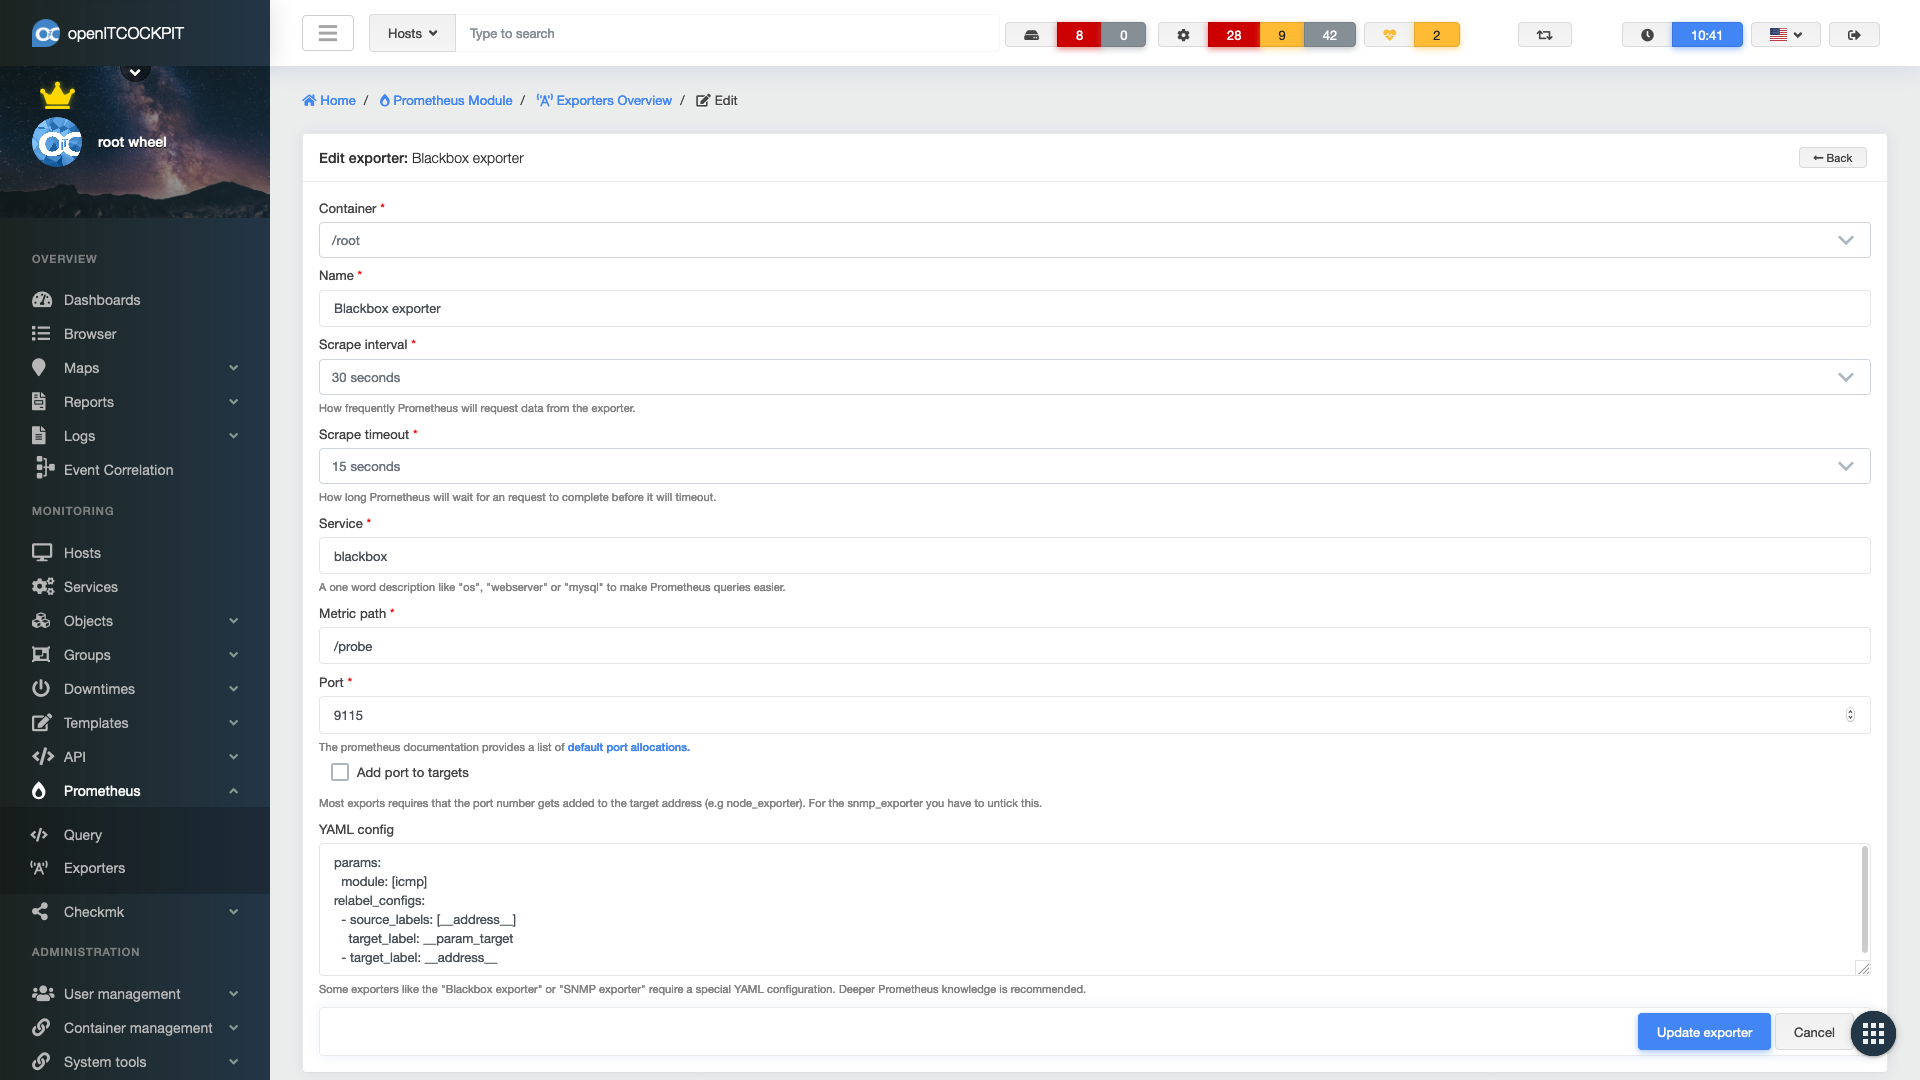
Exporters can be managed via the openITCOCKPIT interface. To getting started a pre-defined subset of exporters is included.
To monitor a host through Prometheus just open up the host configuration and select which Prometheus exporters should be used. Prometheus exporters can also be defined in the host template.
That’s it. There is nothing more to do than assigning the exporters to the host and refresh the monitoring configuration.
Creating alert rules
Alert rules are the bridge between openITCOCKPIT Services and Prometheus. Every alert rule will create an openITCOCKPIT service automatically in the backend. Prometheus using a own query language called PromQL to query the metrics from the system. Which feels complex in the first place is awesome once you are used to it.
PromQL provides a rich set of mathematical functions and operators which could be used to calculate a subset of metrics into a new metric.
For example:
node_memory_MemAvailable_bytes / node_memory_MemTotal_bytes * 100 = Used memory in percent
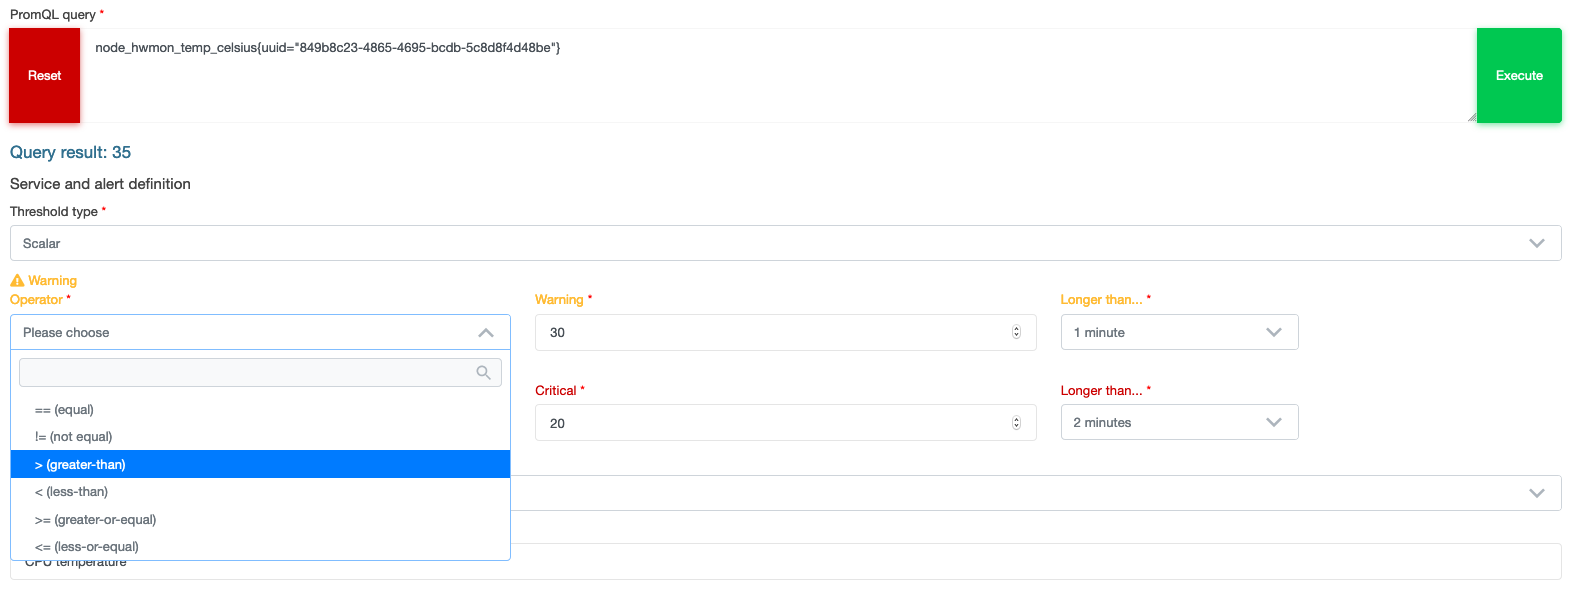
To keep things simple openITCOCKPIT provides a graphical editor to create Prometheus queries and alert rules.
Different types of thresholds
Depending on your needs you can define scalar or range based thresholds. Scalar thresholds are the common used once for disk, cpu or memory usage. Range based thresholds could be used for monitoring temperatures or rounds per minute of an engine or other Industry 4.0 use cases.
Scalar thresholds
Exclusive range thresholds
openITCOCKPIT shows the current ranges in a graphic to make it visible when the thresholds for warning and critical values gets reached.
Inclusive range thresholds
Of course it is possible to update existing alert rules or to navigate through them.
Mixing monitoring methods
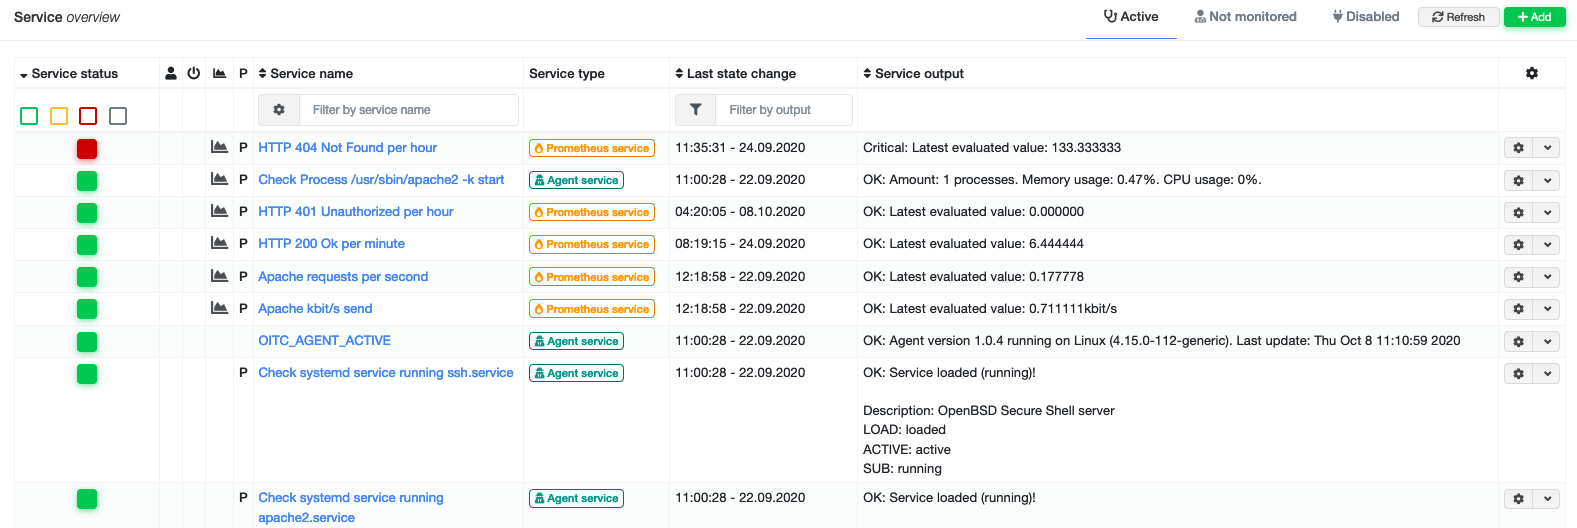
It is even possible to mix both monitoring methods together on the same host. Sky’s the limit.
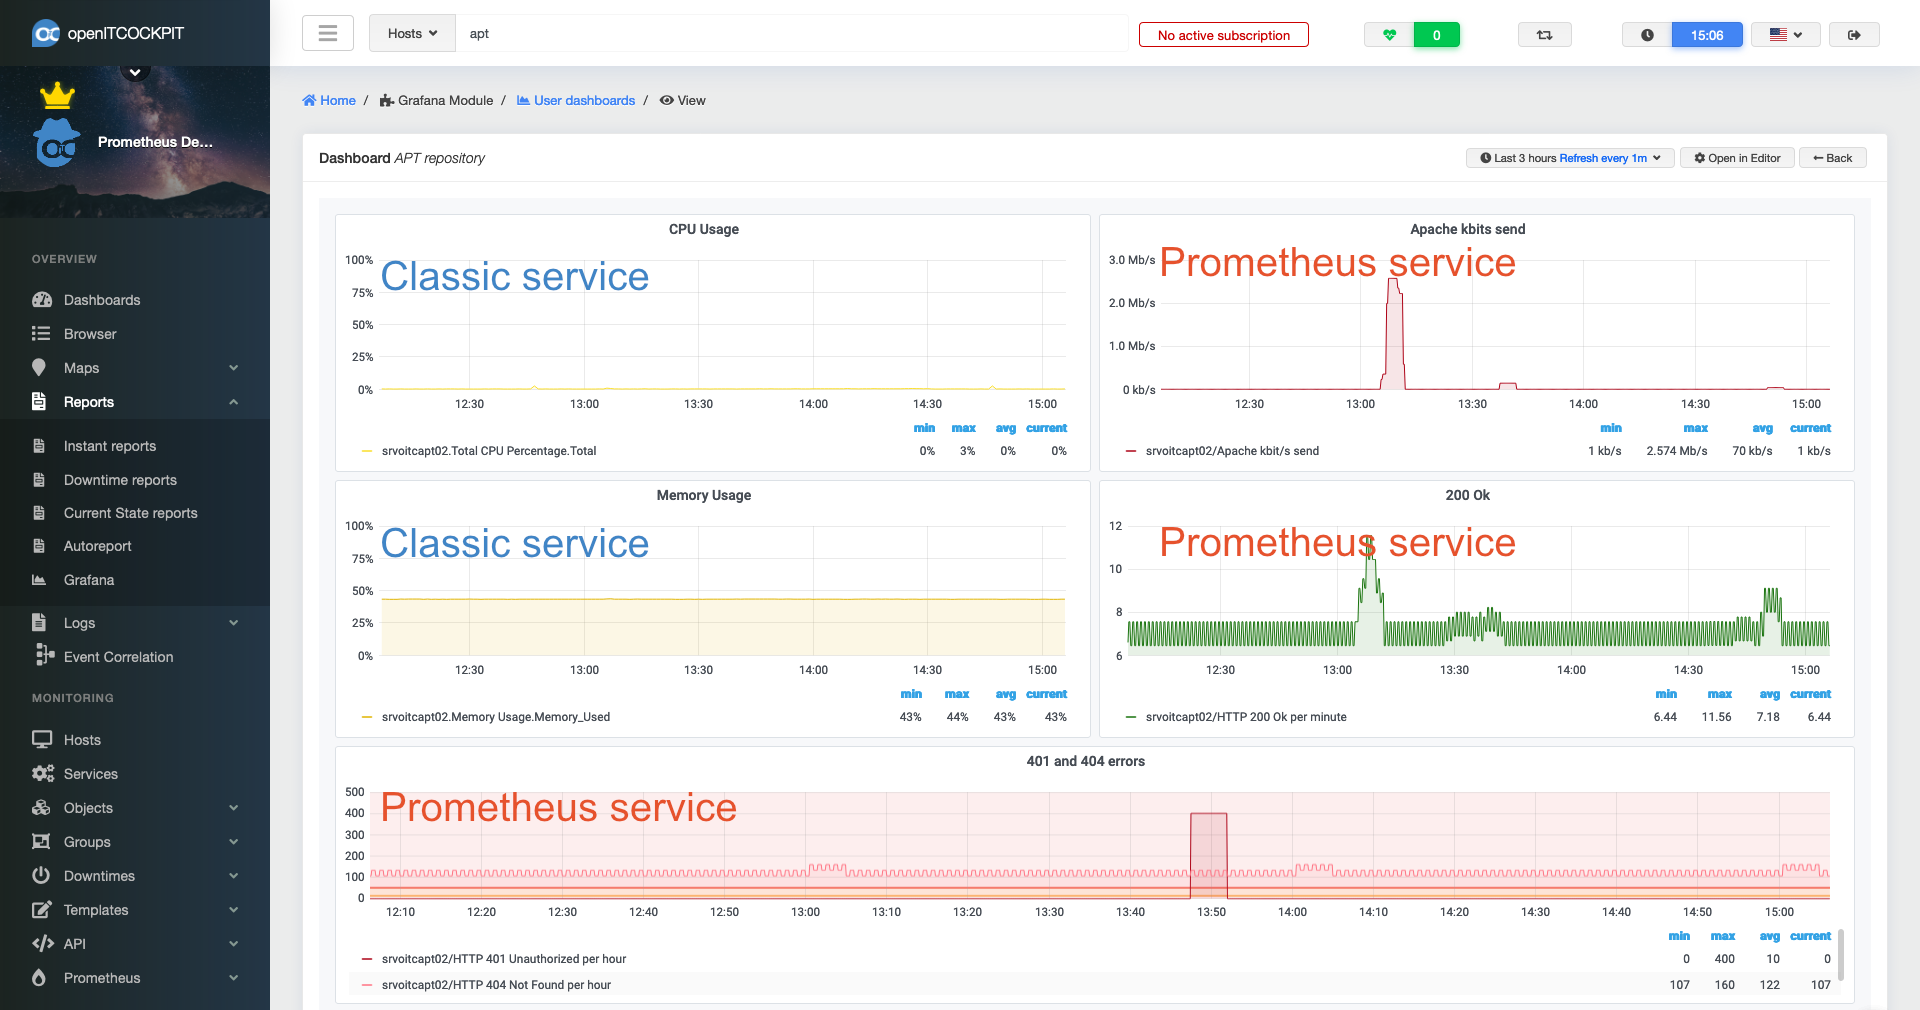
Also both data sources can be used in Grafana - even in the same panel. While creating Grafana dashboards, you don’t event notice if you picked a classic or Prometheus service.
Detect circular parent/child loops
Since openITCOCKPIT 2 the detection of parent/child loops for parent hosts was a missing feature of openITCOCKPIT. The loop detection was only part of the monitoring configuration refresh and most of the time an administrator has to resolve the issue.
We added a new loop detection check directly into the host formulas. Hosts with a loop inside of the parent child logic can’t be saved anymore.
Add aggregation methods to charts
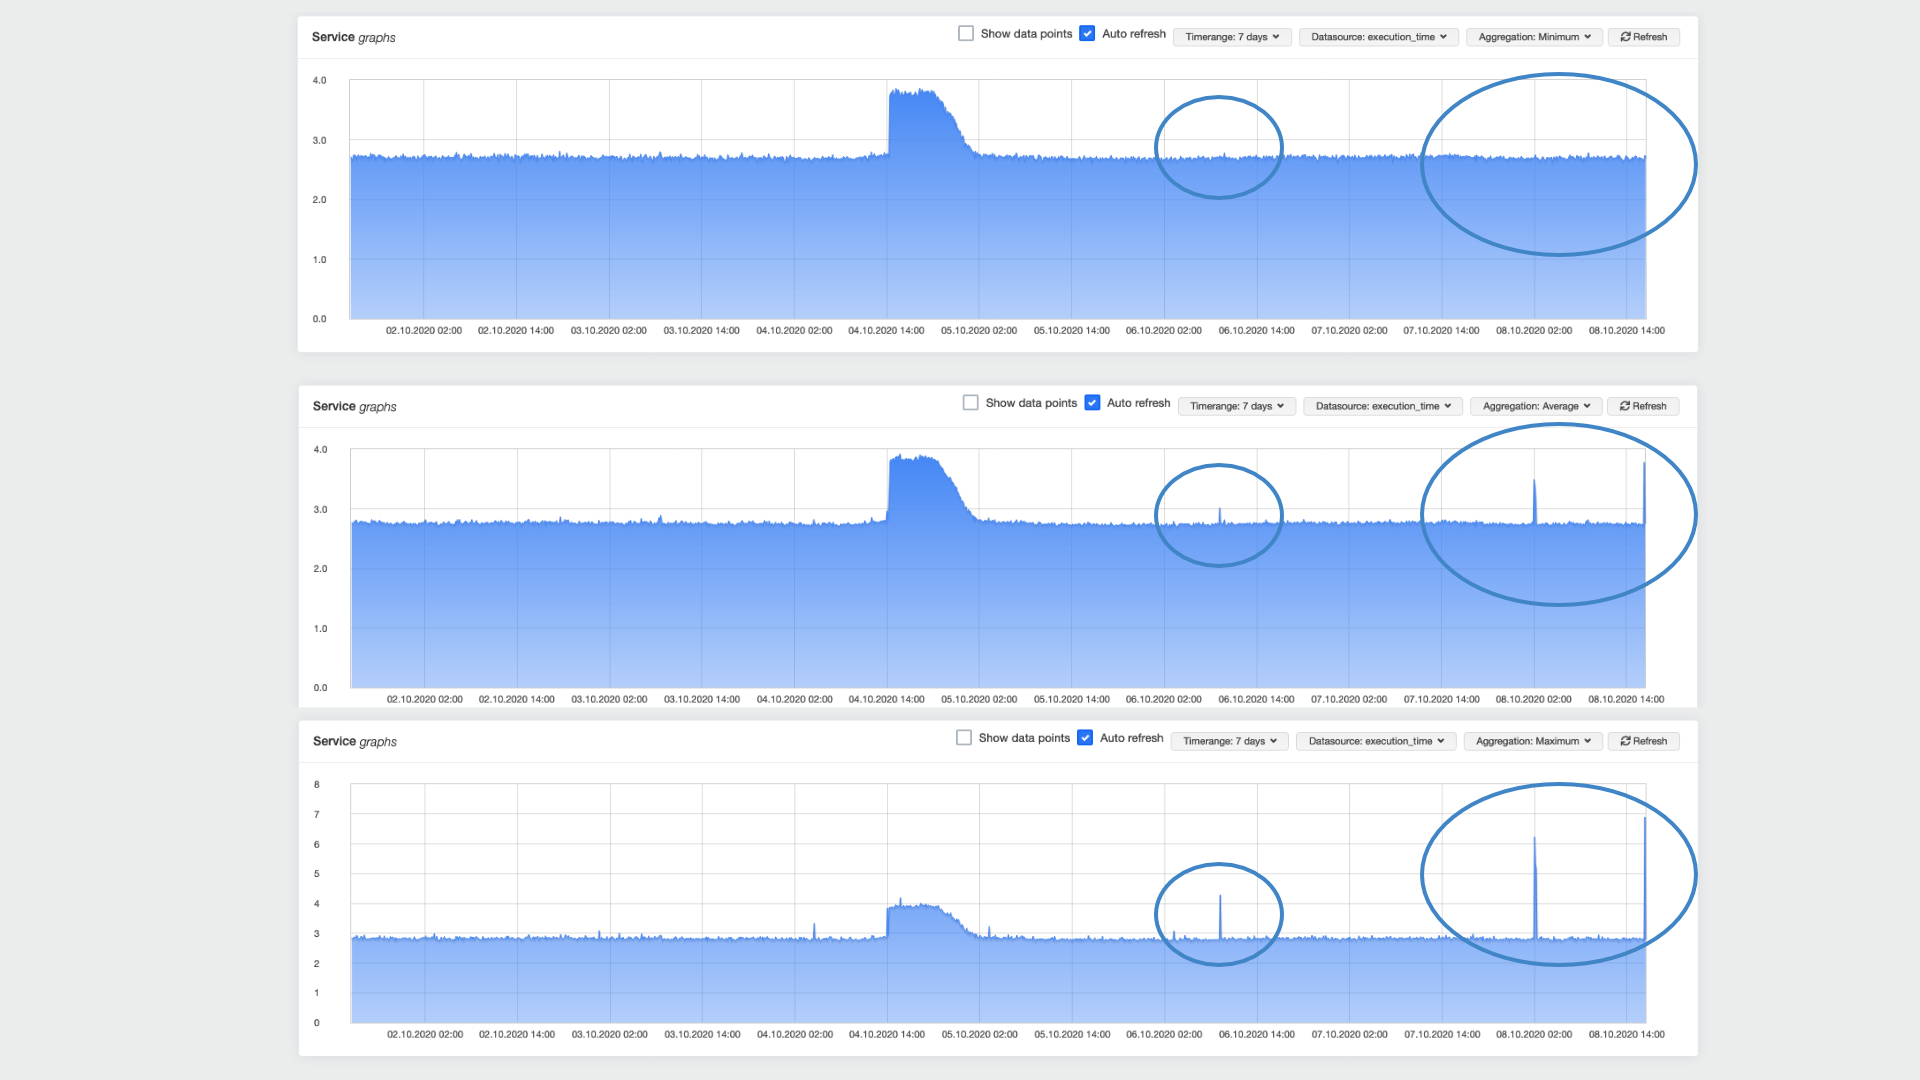
By default openITCOCKPIT aggregated charts by average. Especially for charts that represent a response time or network bandwidth the average representation will hide peaks. This makes it hard to identify a bottleneck. We had add the aggregated methods minimum, average and maximum to the charts so you can pick what ever meets best.
Implement single sign-on via oAuth2
Single sign-on login via oAuth2 is now also available for openITCOCKPIT 4.
Prominent method to change the current language
The option to change the current language got added to the top menu to be quickly changeable during video calls or presentations.
Major bug fixes for the openITCOCKPIT Monitoring Agent on Windows systems
- On windows systems a wrong checksum got generated for the client TLS certificate so the agent was not able to push it’s data to the openITCOCKPIT Server.
- Resolved crshing of the openITCOCKPIT Agent when a user logs in which leads to
UNKNOWN: cURL error 28: Connection timed out after 10004 milliseconds (see https://curl.haxx.se/libcurl/c/libcurl-errors.html). This could also happen on new RDP connections or if the screen went into sleep mode.
Please update your openITCOCKPIT Agent to the latest version.
#### All changes are available in the [changelog](https://github.com/openITCOCKPIT/openITCOCKPIT/releases/tag/openITCOCKPIT-4.1.0).
How to Update
tmux
sudo apt-get update
sudo apt-get dist-upgrade
Your openITCOCKPIT Team
