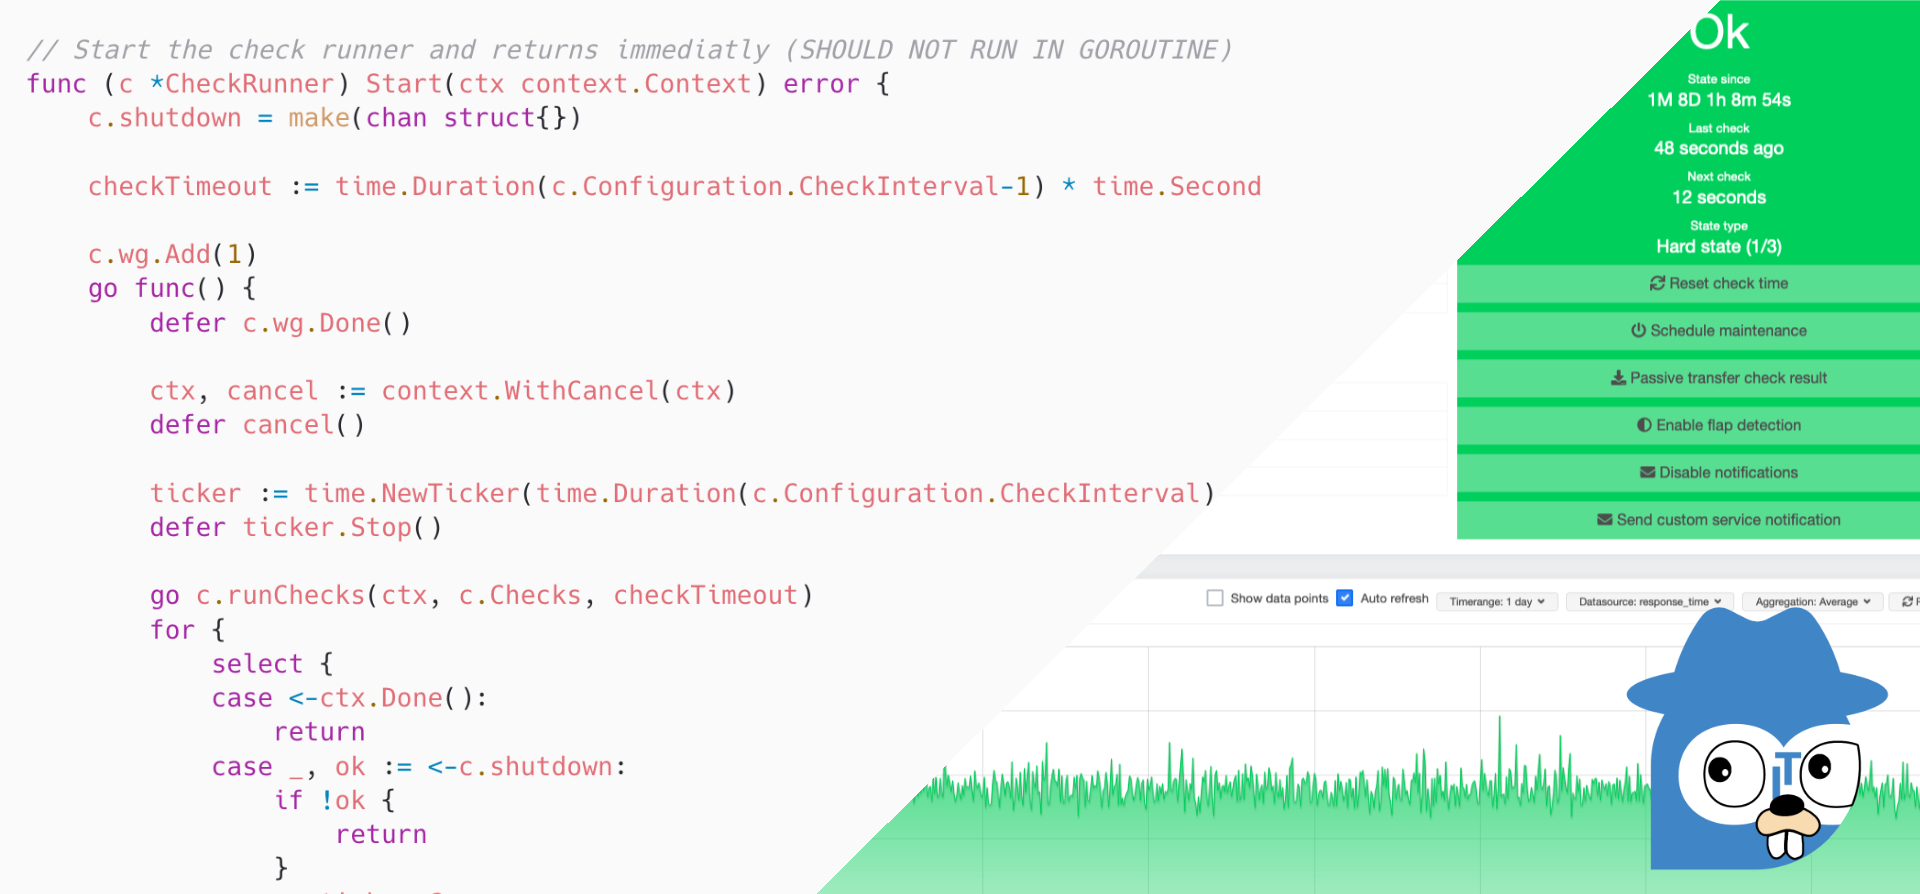
Today we launch the Public Beta of the openITCOCKPIT Monitoring Agent 3.0. Thanks to the feedback from the community users and enterprise customers we know that the openITCOCKPIT Monitoring Agent is very popular. Therefore we want to get rid of any nasty bugs and issues upfront.
To resolve all issues of the Monitoring Agent 1.x (Python) we decided to go the extra mile and to do a full rewrite of the software with Go.
Missed by many users openITCOCKPIT finally got an generic interface to import host and services from external services and datasources.
We invite everyone to provide feedback about the Beta version of the Import Module. The stable release of the module will be included with openITCOCKPIT 4.2
Architecture
The Import Module was designed to be easily extendable. It can be extended by submodules to add more data sources in future versions. The Beta version only supports to import data from .csv files.
More data sources are planned.
All imported hosts get stored into a dedicated table and the only required field is a hostname or an ip address.
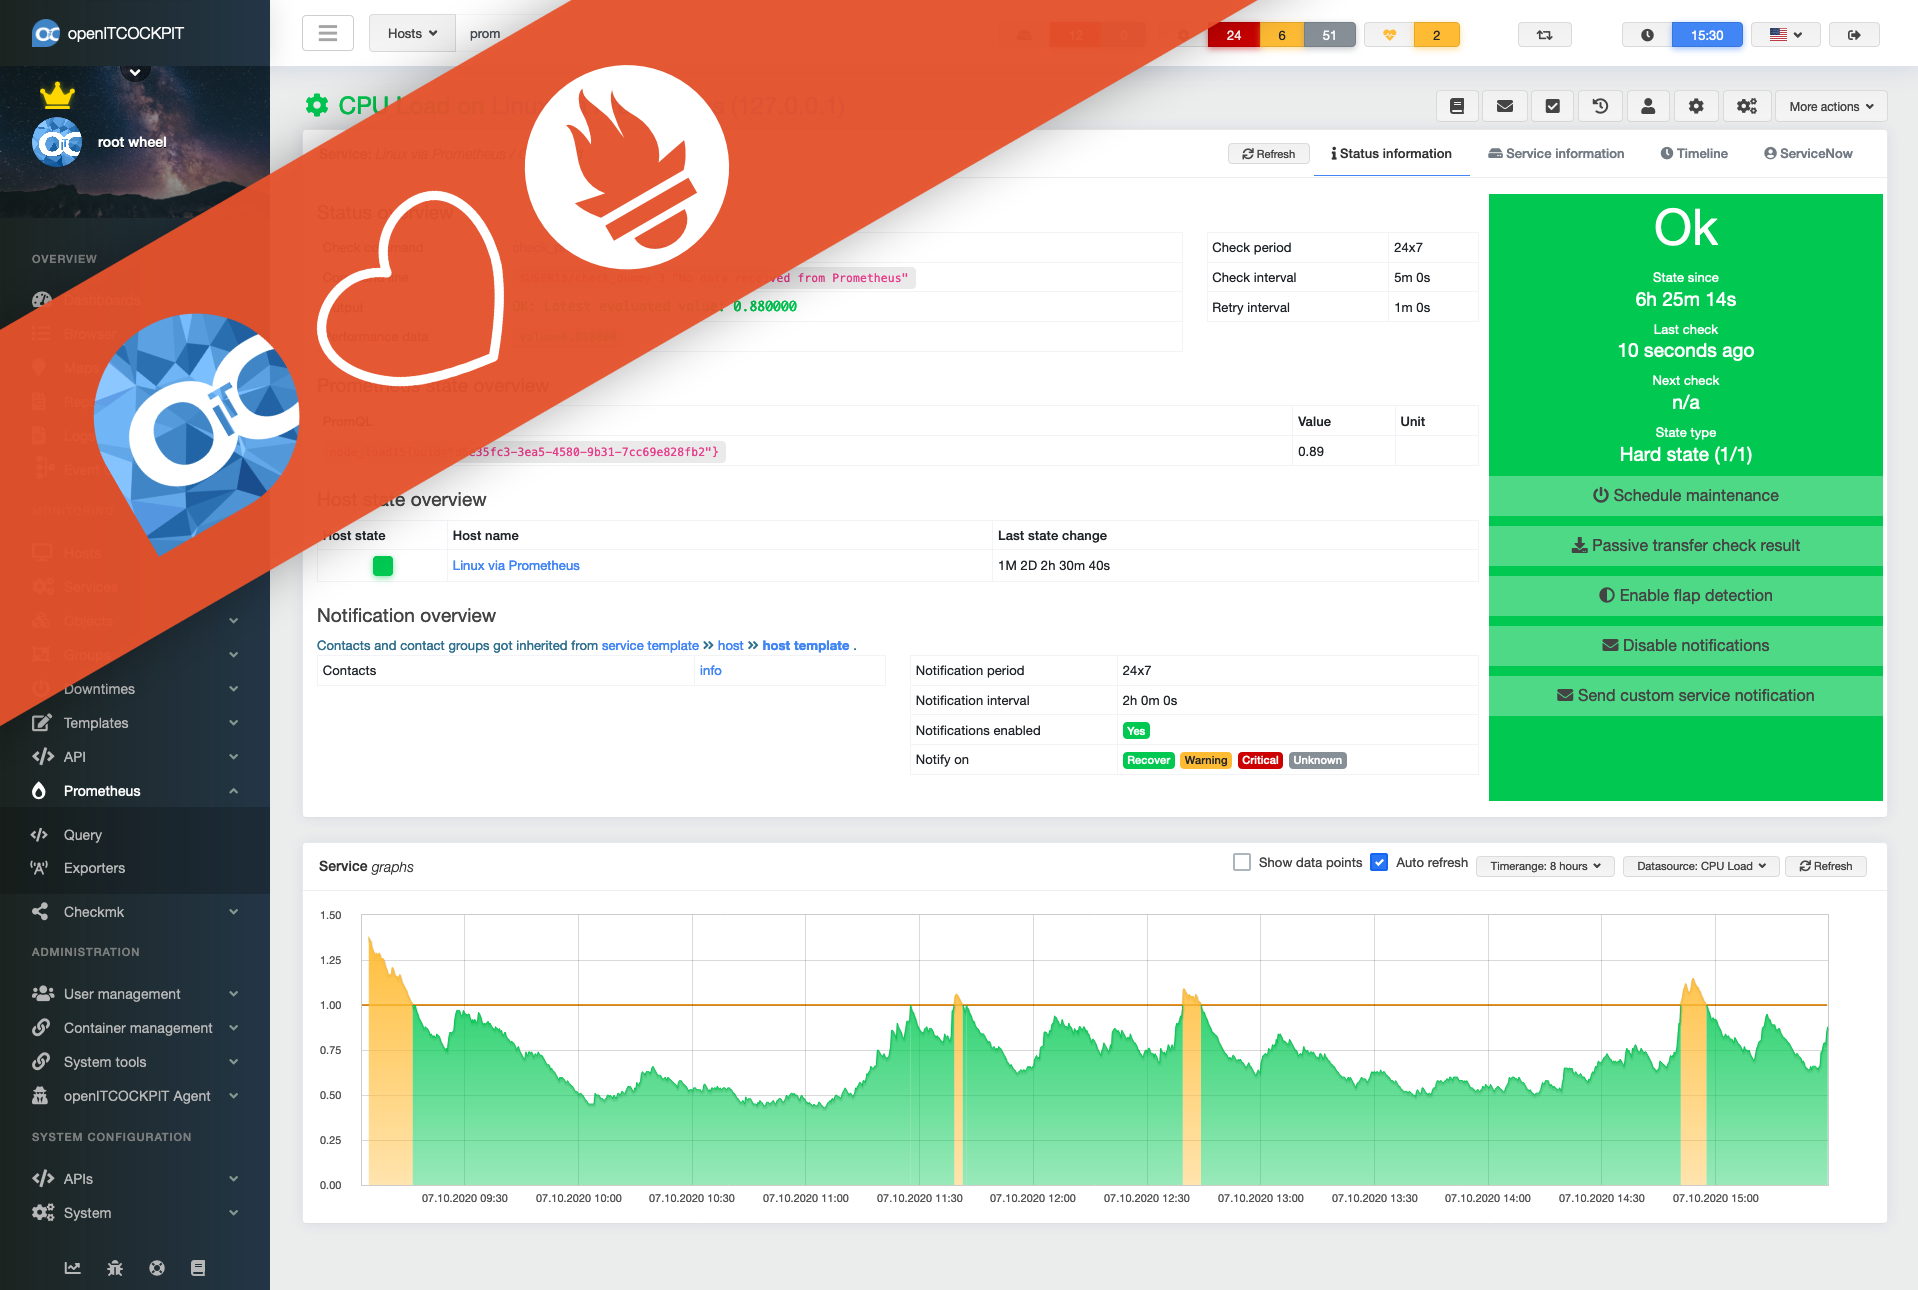
openITCOCKPIT welcomes Prometheus as the newest member to our monitoring family. IT infrastructure has so many facets from bare metal to containers over switches and routers to Industry 4.0.
As times are changing also the monitoring system has to evolve. Our goal was a seamlessly integration of Prometheus into openITCOCKPIT.
All openITCOCKPIT features you are used to are also available for Prometheus monitored services. Autoreports, event correlations, Grafana dashboards, usage of the same contacts, scheduled downtimes and acknowledge issues - all this is possible.
Most of the time you will not notice which monitoring engine gets used in the backend.
openITCOCKPIT has been around for more than 15 years. Since the first release the openITCOCKPIT interface is the key component. Our mission is to create an easy-to-use, modern and responsive web frontend.
Single-page application
For the first time, openITCOCKPIT interface is 100% based on openITCOCKPIT API interface and runs as a single-page application. This approach is snappy and responsive and feels more like a desktop application than a web-based one.
But not only did we refactor the technical components from scratch, we also added a whole bunch of little helps to the interface. Tools such like “Create another” checkbox, a new menu structure and an optimized user routing between different actions help you to improve your daily workflow and monitoring experience.
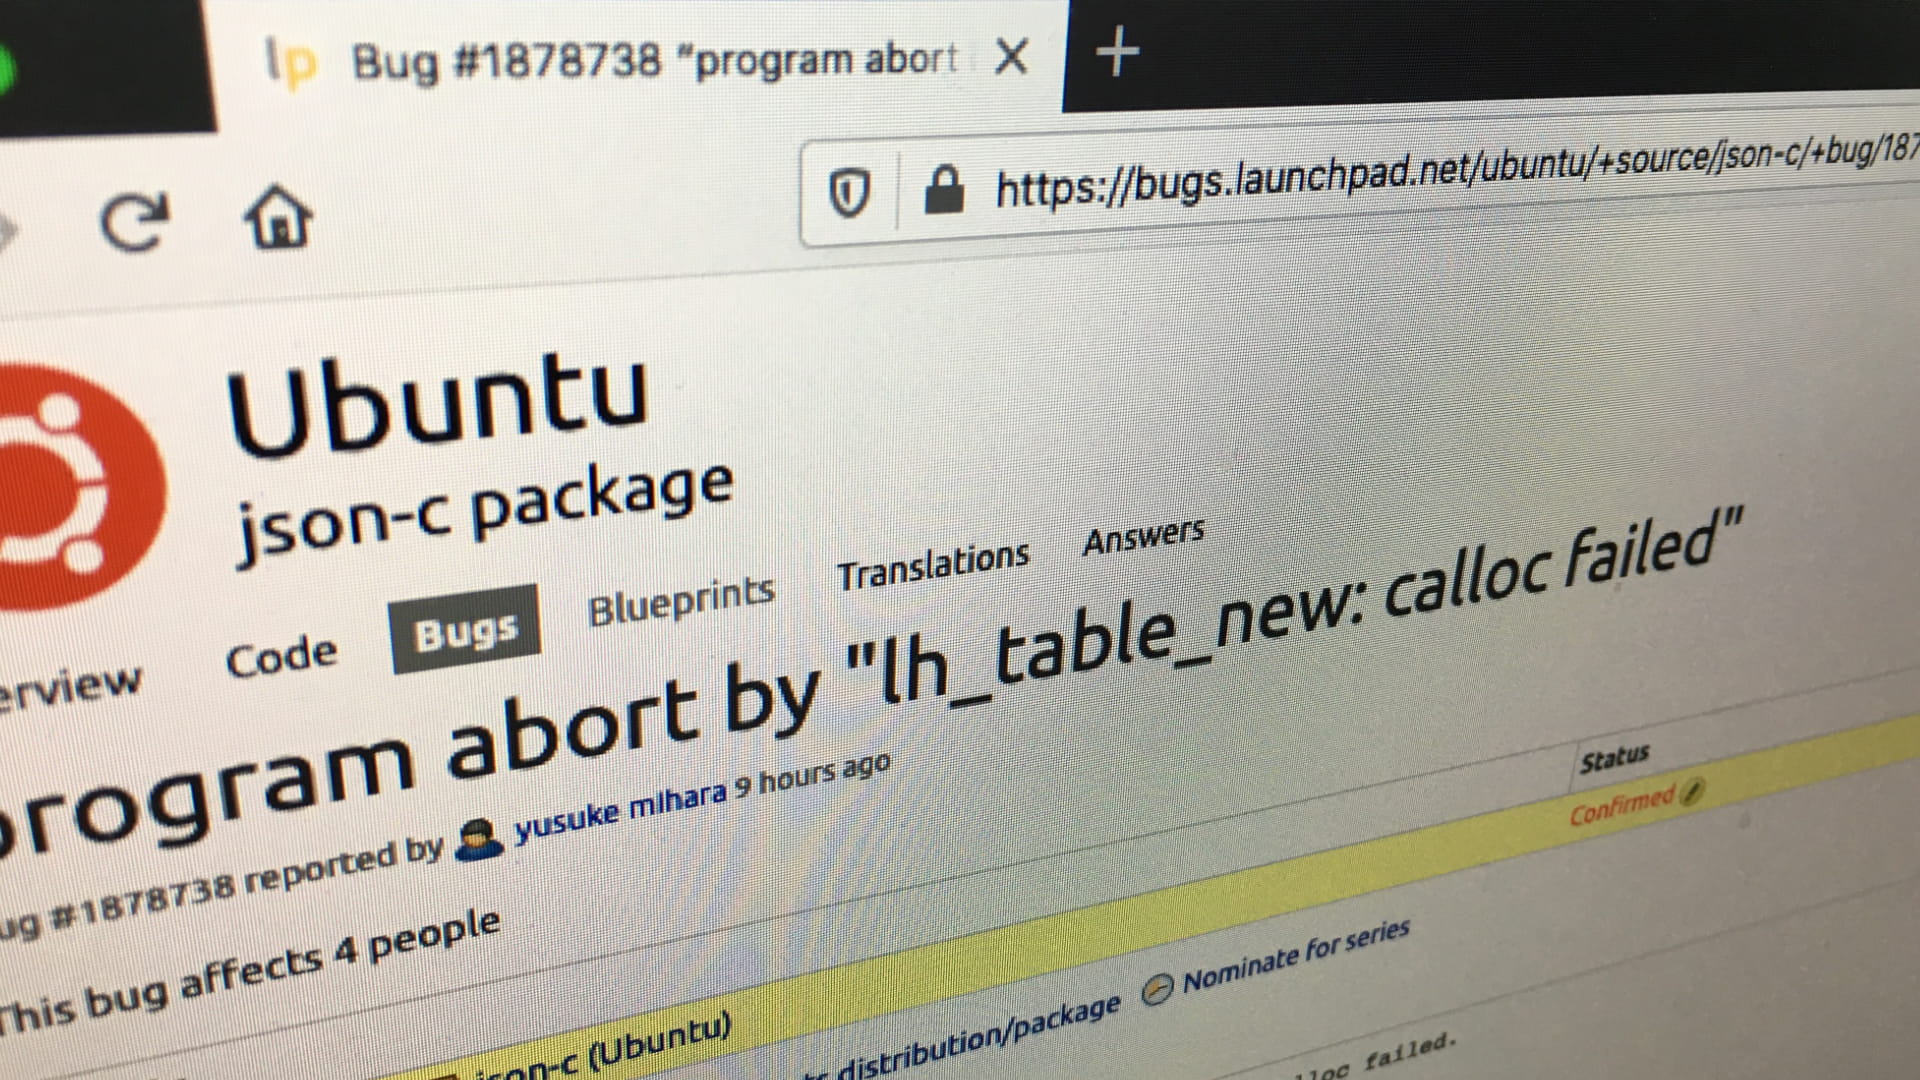
After installing the latest security patches on your system Nagios and Naemon will most likely not work anymore.
The Statusengine Event Broker which gets loaded into the monitoring core depends on the json-c library.
Unfortunately it seems like the patches that should fix security issues CVE-2020-12762 within json-c are causing the problem.
For now the easiest method is to downgrade to the old version of json-c to get your system up and running again.
As far as we know this bug only affects Ubuntu users.