openITCOCKPIT 4.6.2 released
openITCOCKPIT version 4.6.2 has been release and is a minor release with contains bug fixes for several issues.
User defined thresholds for System Health checks
The integrated self monitoring of openITCOCKPIT can now be adjusted by passing own threshold values.
openITCOCKPIT 4.6.1 released
openITCOCKPIT version 4.6.1 has been released. This release contains a workaround for a bug within the mysqldump command.
Usually we never release a new version on a friday and the last stable release has happen only four days ago.
How ever, we noticed a breaking change within the mysqldump command from version 8.0.31 to 8.0.32.
openITCOCKPIT 4.6.0 released
openITCOCKPIT version 4.6.0 has been released. This release is packed with new features and improvements so update now 😊
SLA Reporting
One of the new major features is the Service-level agreement (SLA) Module. The model can be used to define one or multiple SLAs with different thresholds. The SLA module follows the same logic as all reports from openITCOCKPIT, so you can decide if outages that occurs during a scheduled downtime (maintenance) should be ignored. In addition it is possible to define own time periods (for example 24x7 or 5x8) and bank holidays for the SLA calculation.
The complete documentation is here available.
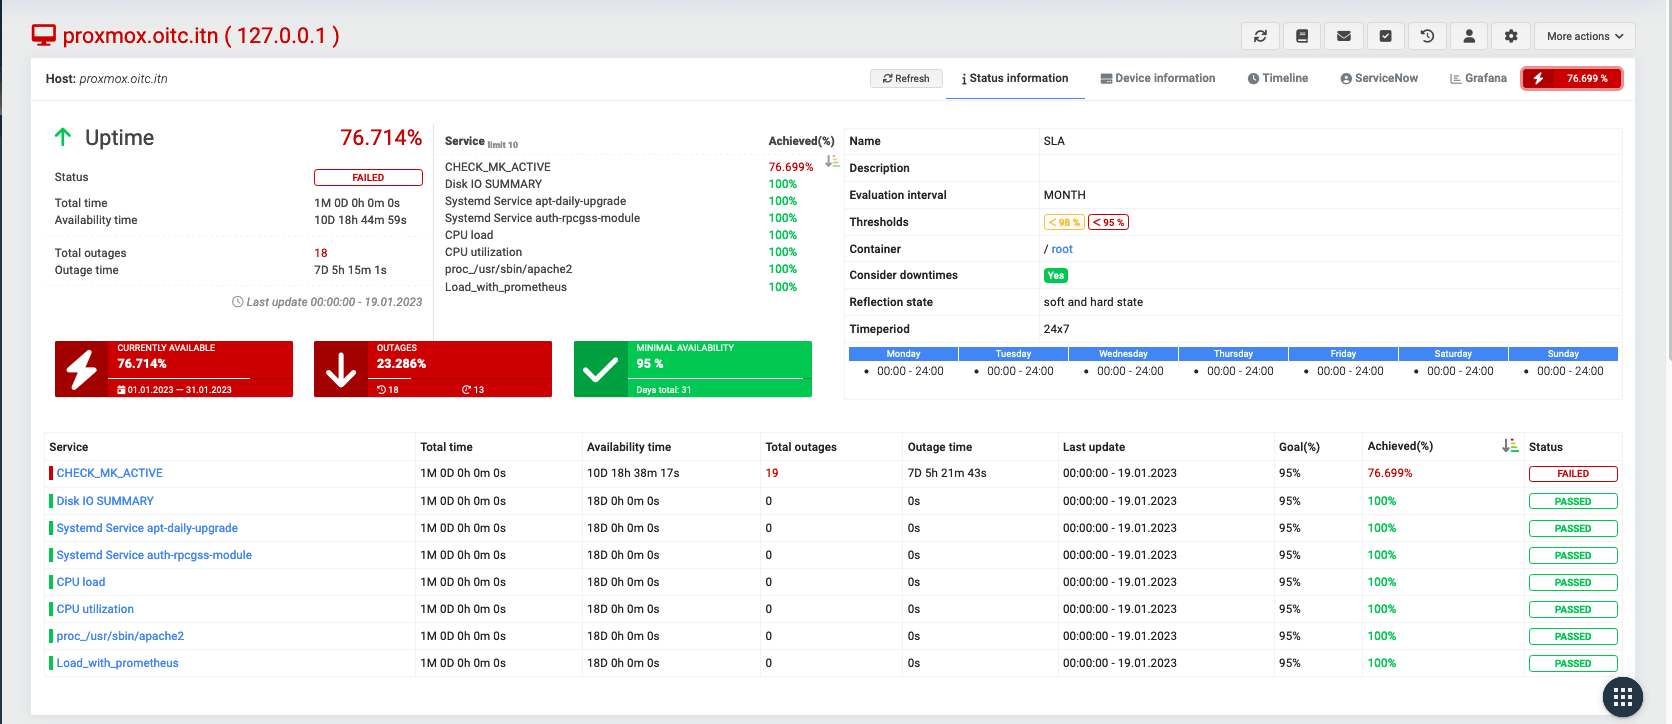
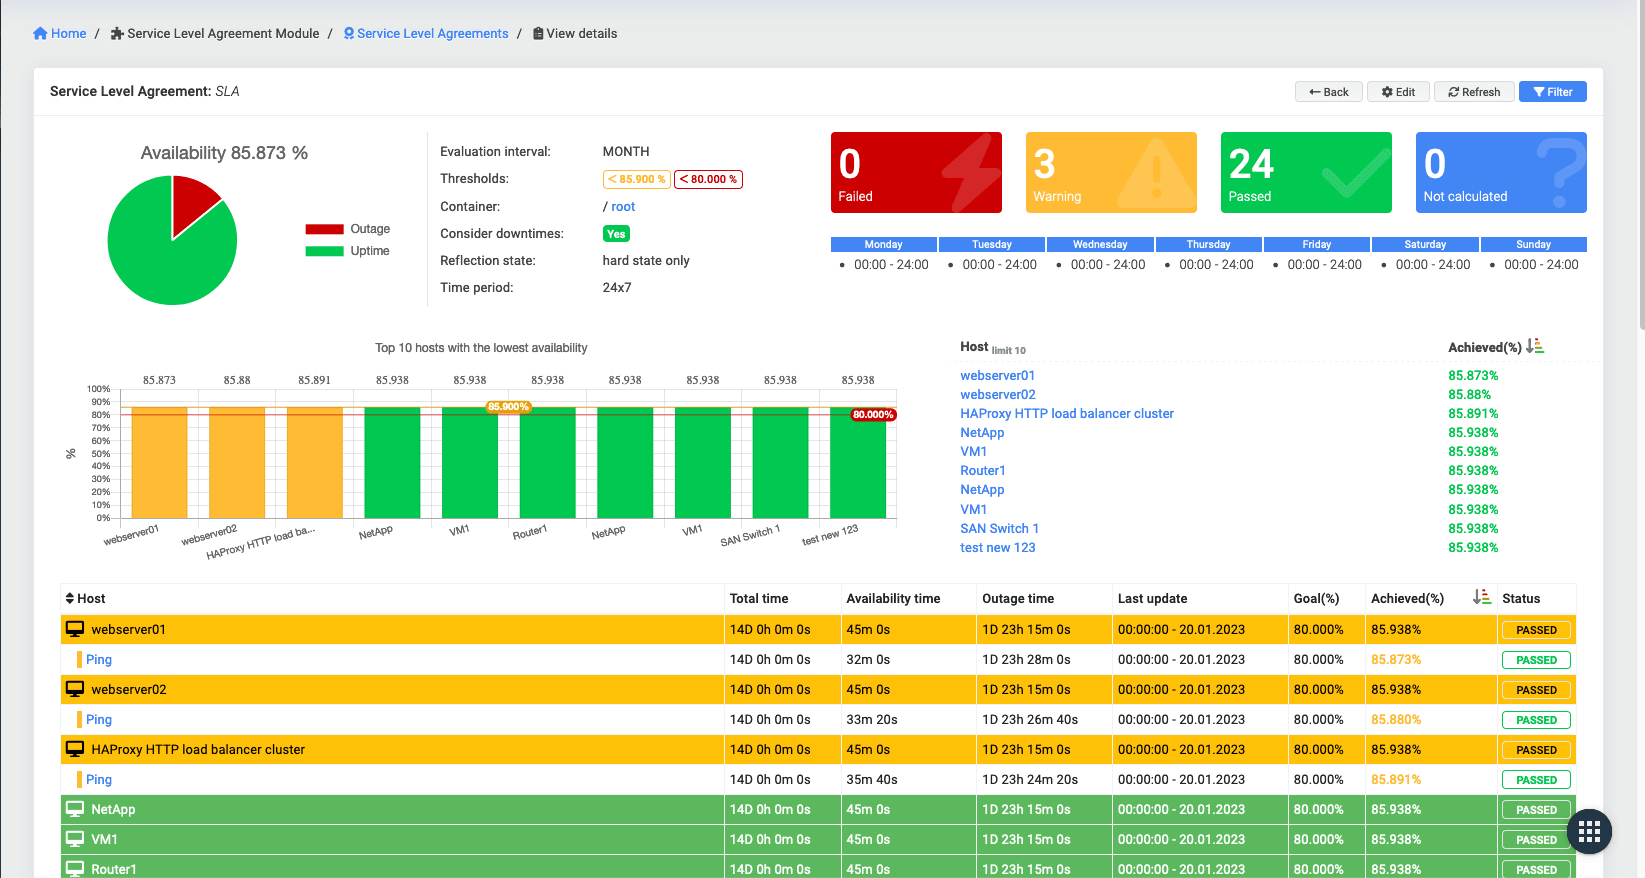
SLAs could be assigend via a host template, the host configuration or through a mass assignment. The SLA calculation will be done one a day. The current availability will be shown at the details page of a host or service. There is also a detailed overview about the current availability per host and service available.
Of course the SLA Module also provide an overview of all objects which are taken into account by the SLA.
openITCOCKPIT 4.5.5 released
openITCOCKPIT version 4.5.5 has been released - One of your new year’s resolutions should be, to update your openITCOCKPIT installation 😉.
Upcoming changes
openITCOCKPIT and the underlying components will require at least PHP 7.4 with the next minor release (openITCOCKPIT 4.6). Please be aware that PHP 7.4 is already end of life since 28 Nov 2022. How ever, there are still versions of Ubuntu and Debian, that ship even older versions of PHP.
For this reason we decided to drop support for Ubuntu Bionic and Debian Buster.
openITCOCKPIT 4.5.4 released
openITCOCKPIT version 4.5.4 has been released.
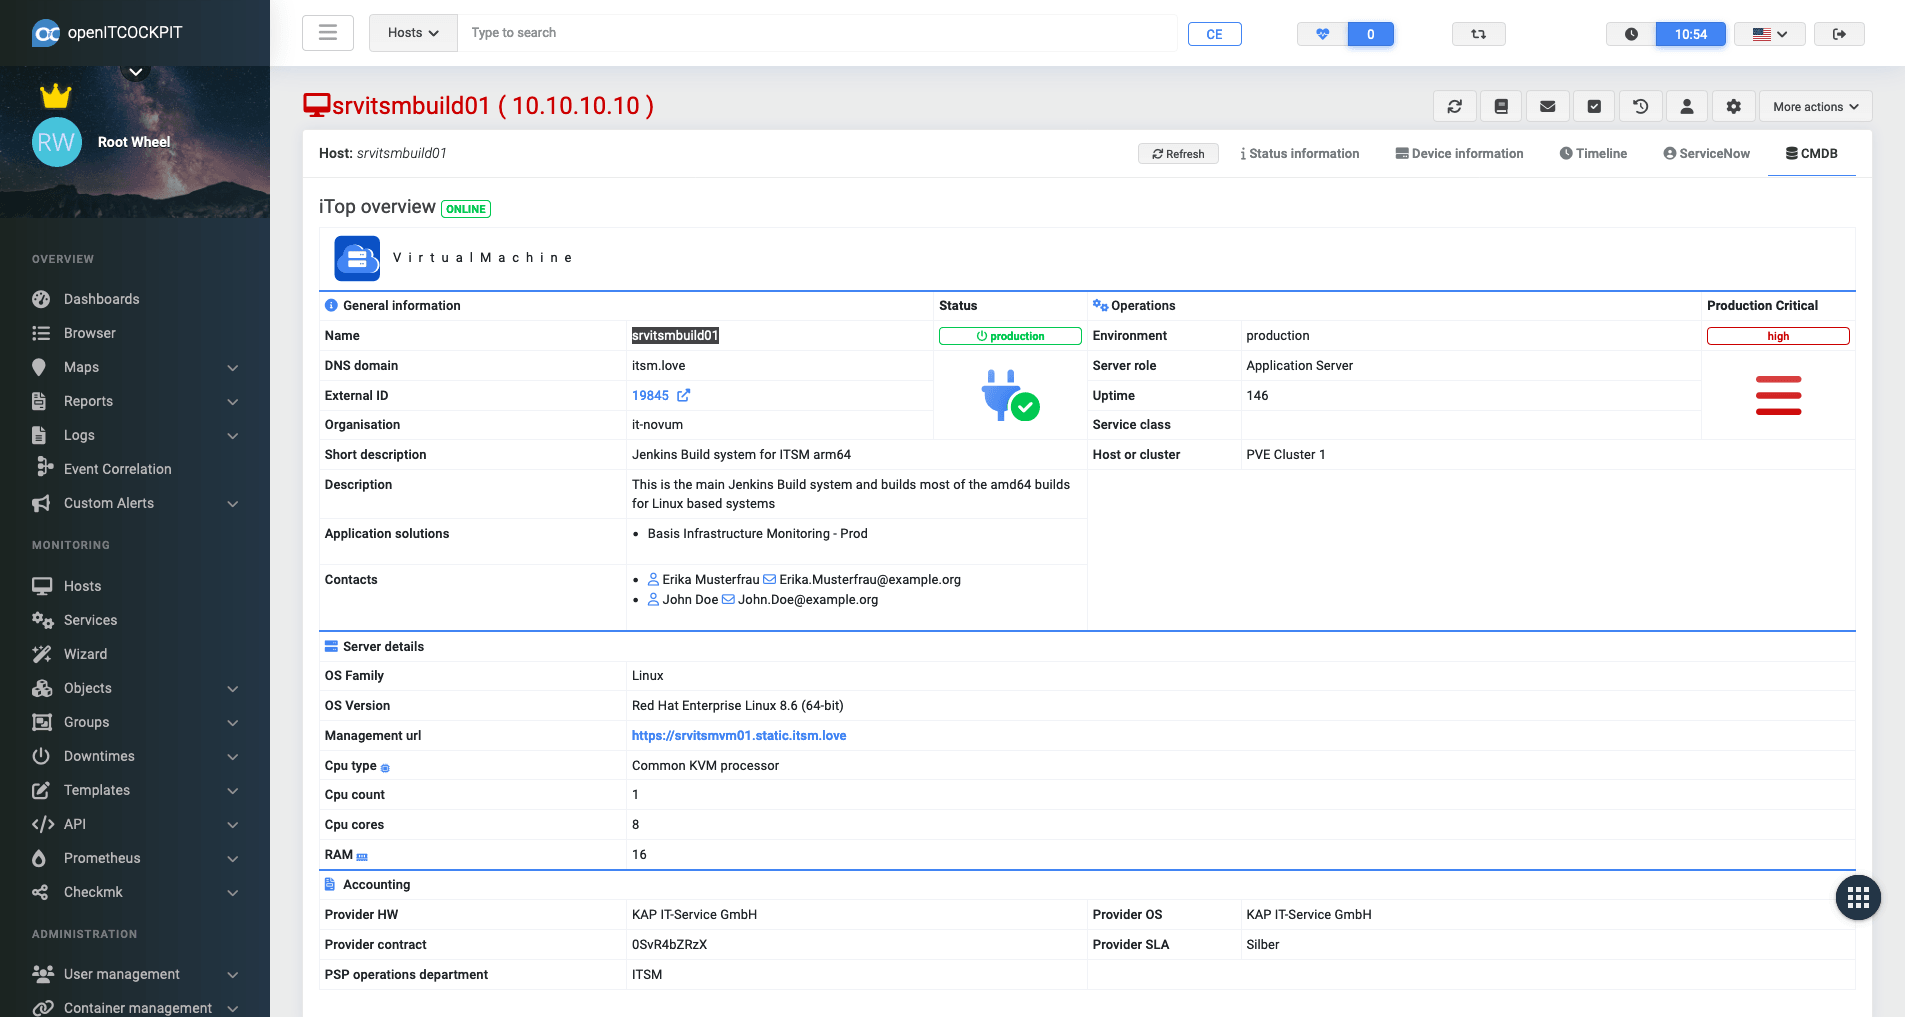
Import Module: Improved Combodo iTop CMDB view
Based on the provided user feedback, we optimized which fields of the iTop CMDB will diplayed in openITCOCKPIT.
SELinux
openITCOCKPIT will now install required SELinux rules on RHEL based systems automaticaly. The rule files are provided by separate packages:
openitcockpit-selinuxopenitcockpit-satellite-selinux
The rule files are located at /opt/openitc/selinux/.


