openITCOCKPIT 3.5.0 released
Today we proudly released the next version of openITCOCKPIT 3.5.0.
New Dashboards
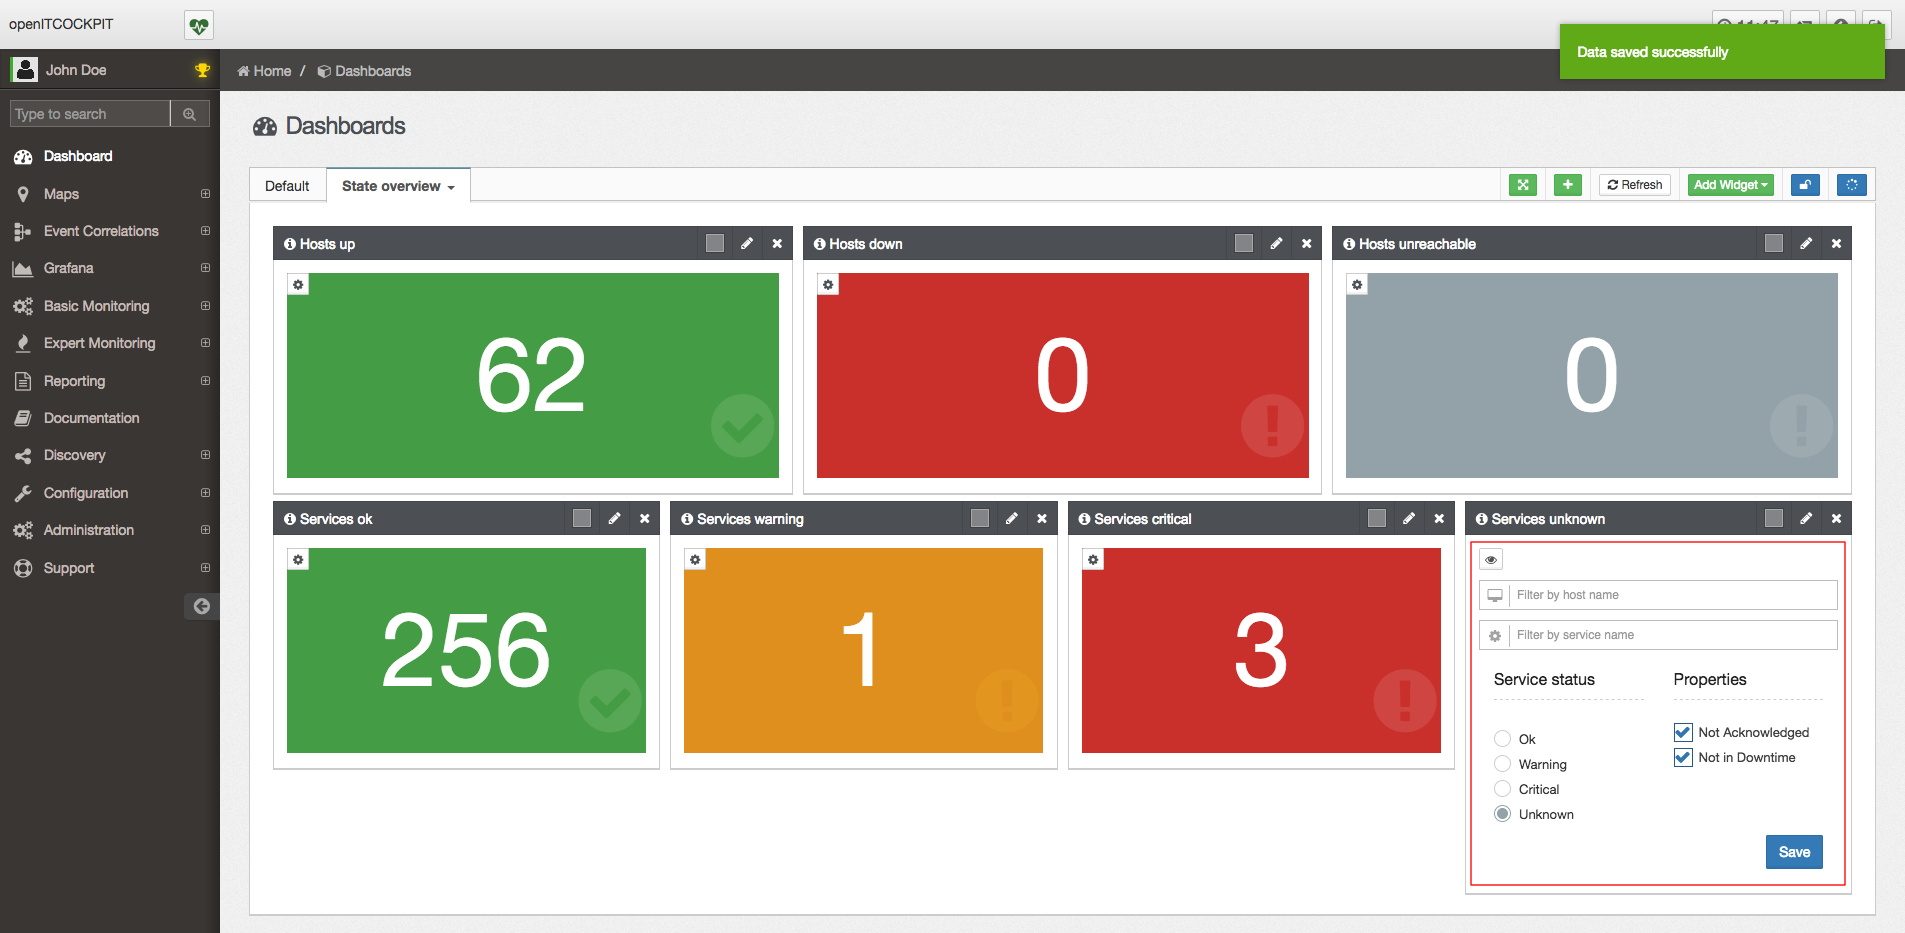
With openITCOCKPIT 3.5 we are introducing complete new dashboards.
Fair warning
With the update of openITCOCKPIT to version 3.5 all existing user dashboards will be deleted!
Please tell the users of the system to take a screenshot of their current dashboard before you run the update.
To fit the dashboards into the module concept of openITCOCKPIT, we wrote the dashboards code from scratch.
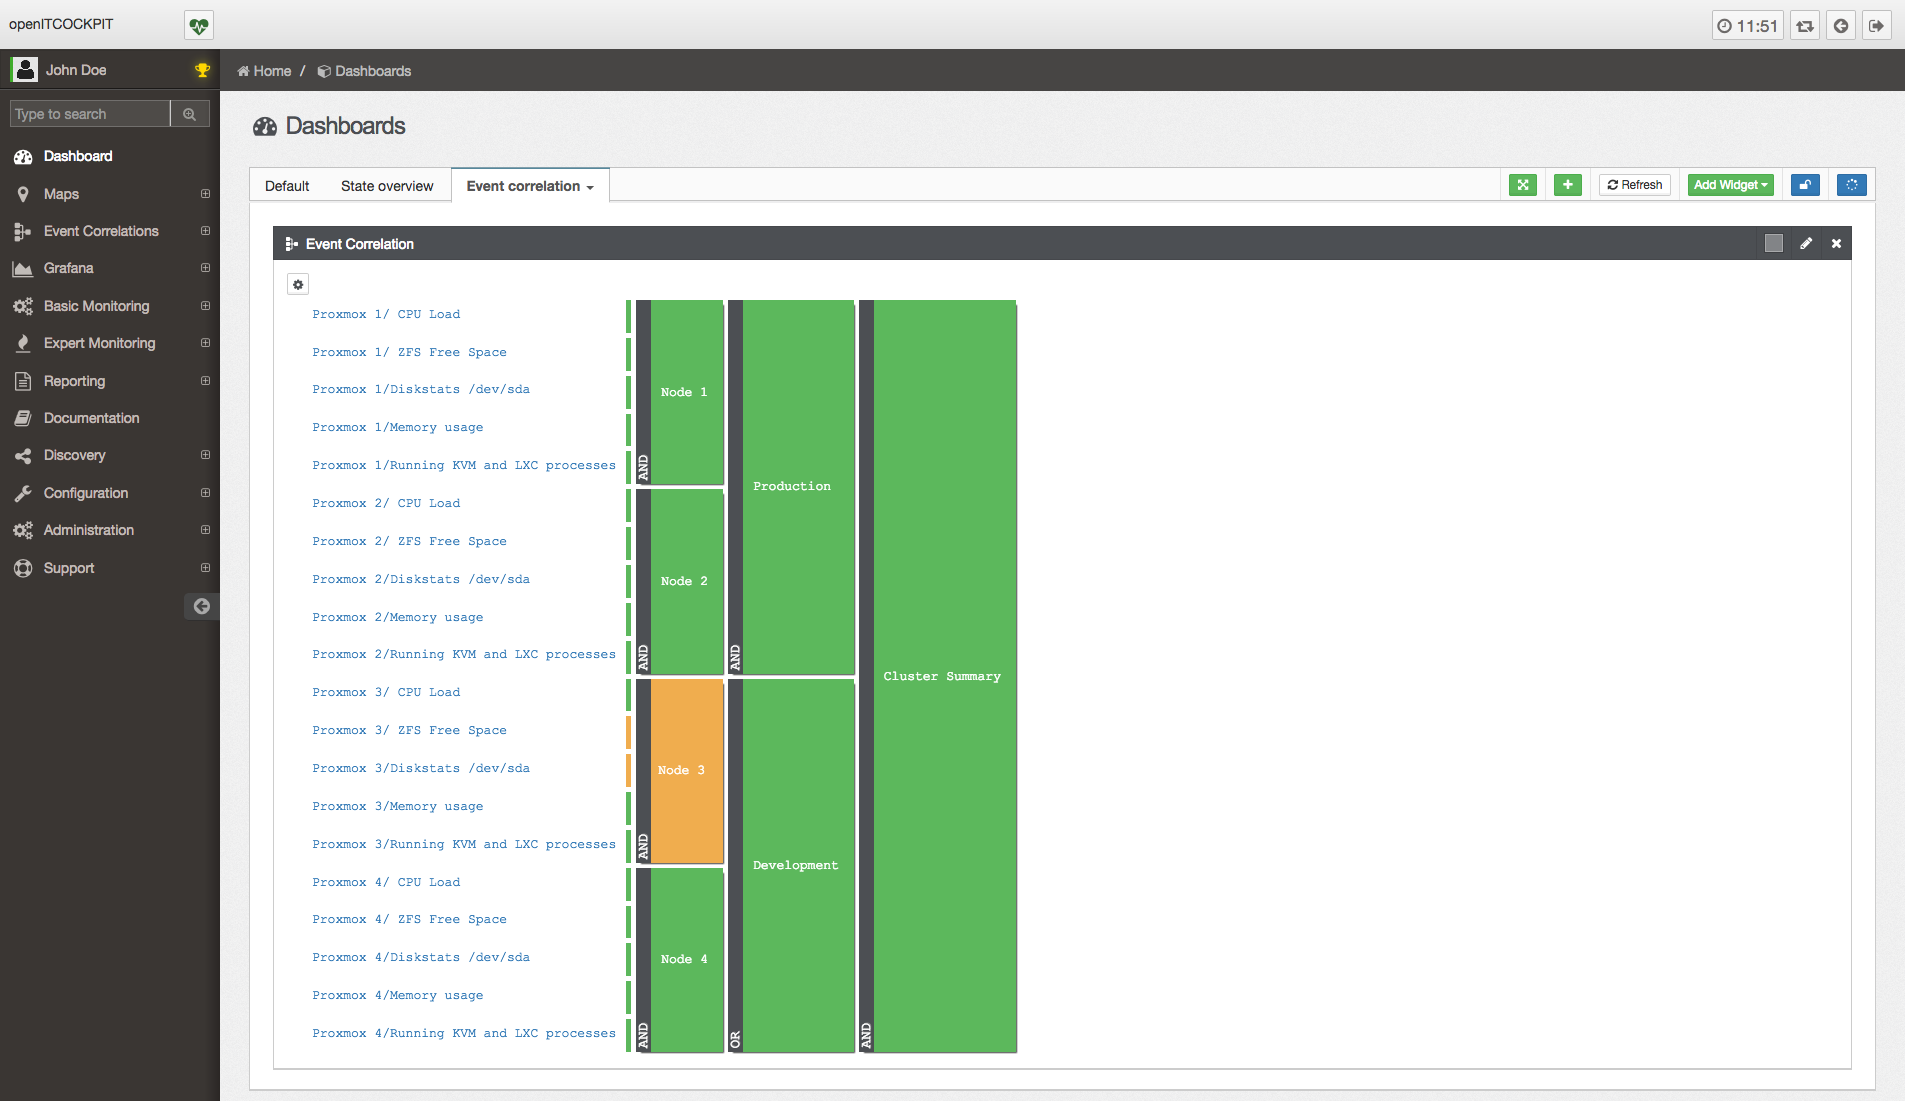
We added new widgets for Host status overview, Event correlation and User defined Grafana dashboards.
Most widgets now include search and filter options.
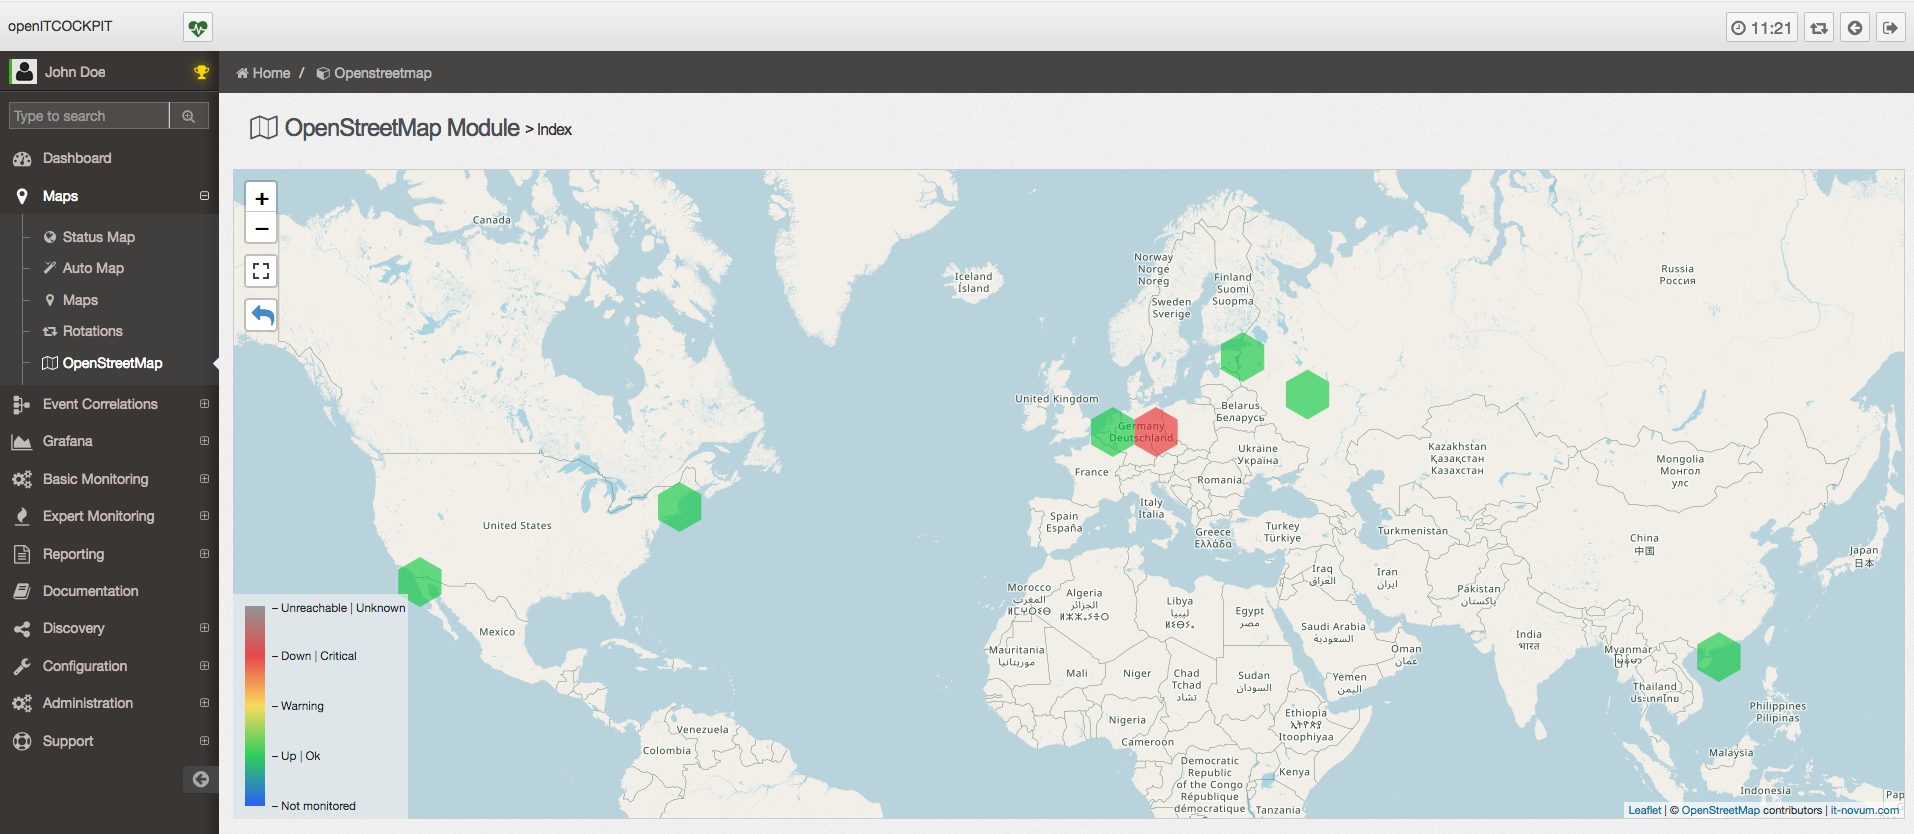
OpenStreetMap integration Enterprise
The OpenStreetMap integration makes use of the openITCOCKPIT location objects (Latitude and Longitude need to be set) and displays the current state of the locations.
Depending on the zoom level, overlapping locations will be merged together. By zooming closer, the locations will be splitted up again.
The color will always represent the worst state of a location.
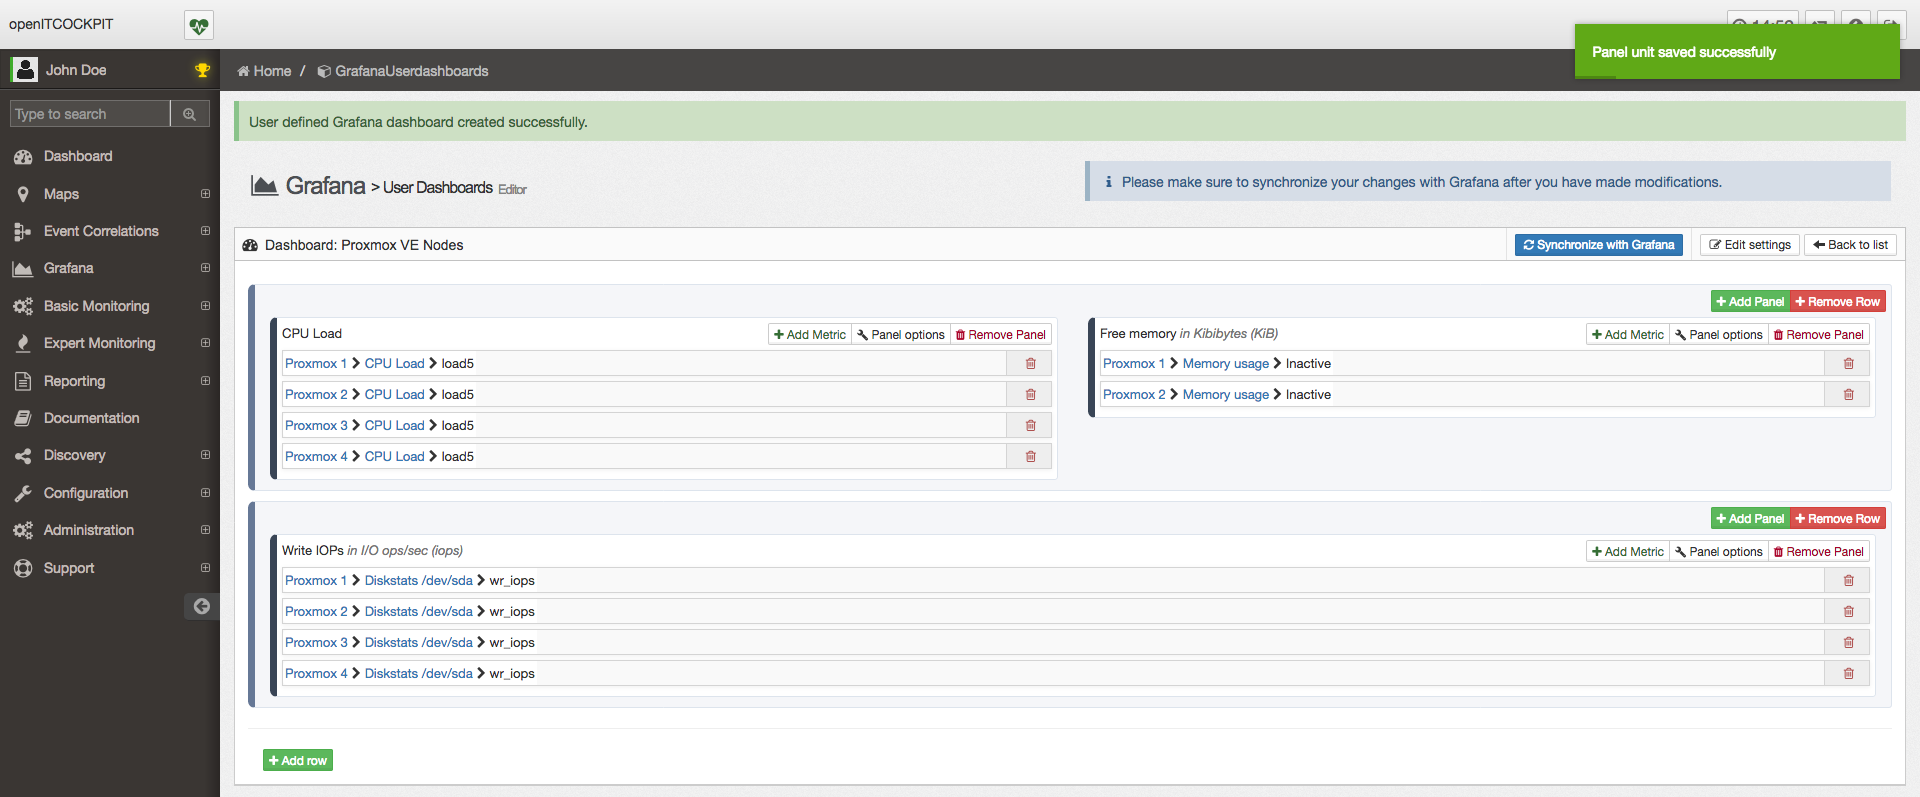
User defined Grafana dashboards
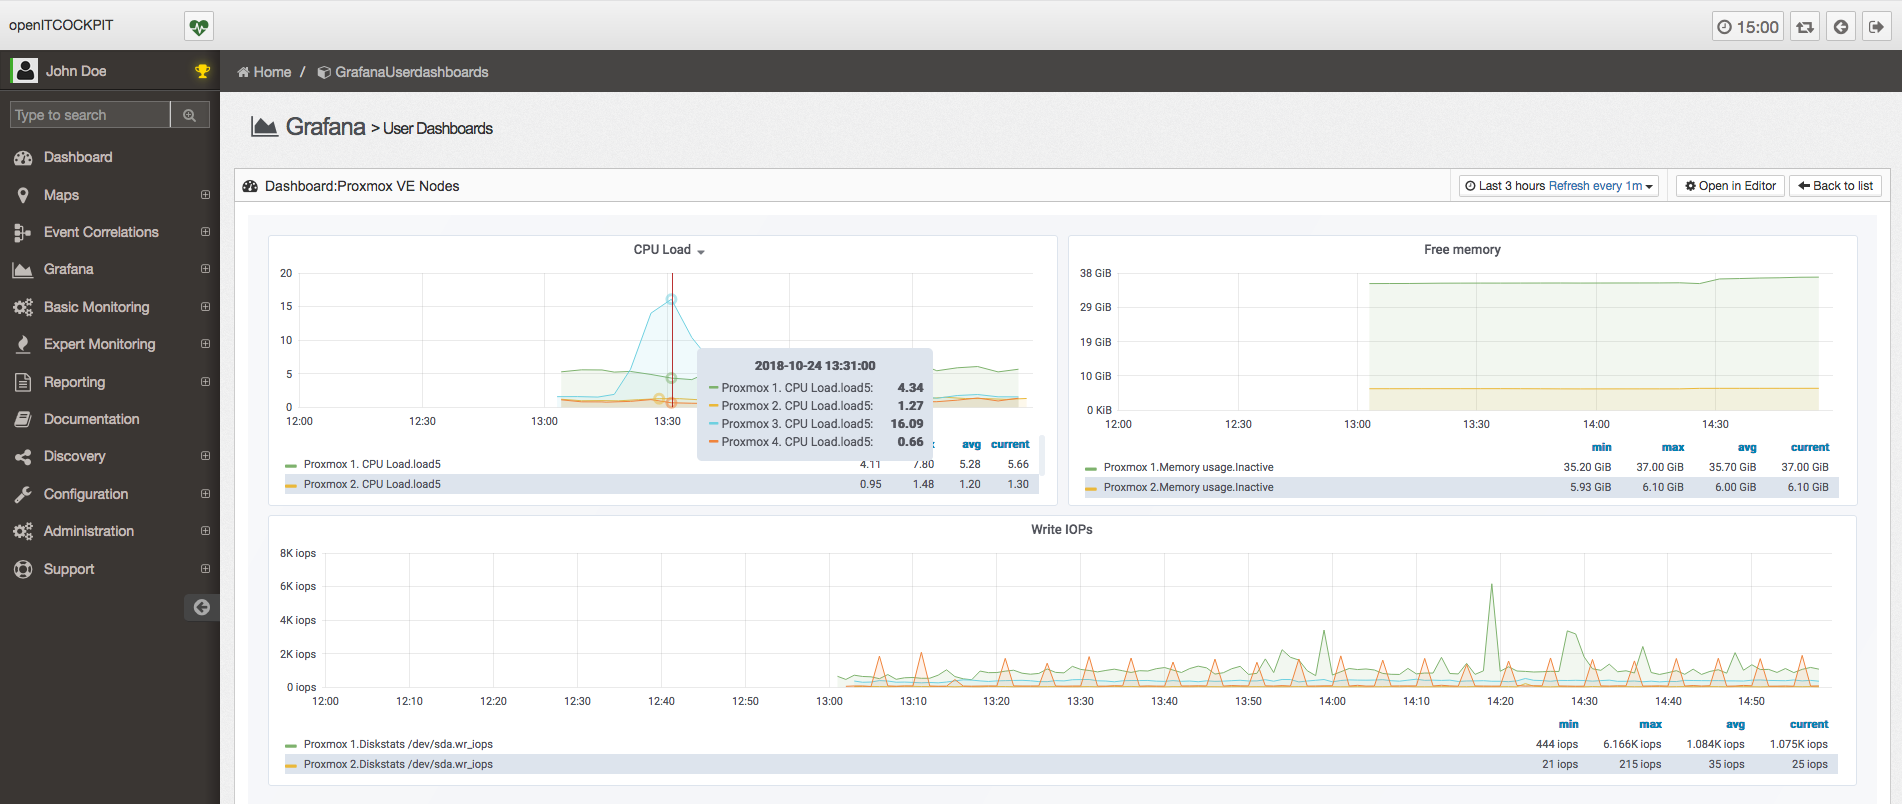
We extended the Grafana Module by User Dashboards. This allows you to create Grafana dashboards through the openITCOCKPIT interface. Even without knowledge of Grafana!
Simple editor
The editor will help you to quickly setup up your dashboards. You can add four panels per row and as much rows as you need. Each panel can have its own unit (like kb, mb, gb, etc) and a title.
Beautiful views
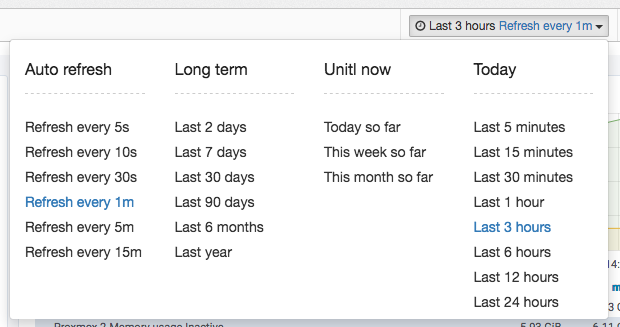
You can also zoom the graphs and select different time frames.
Grafana dashboards can also be used as a Dashboard.
New MapModule
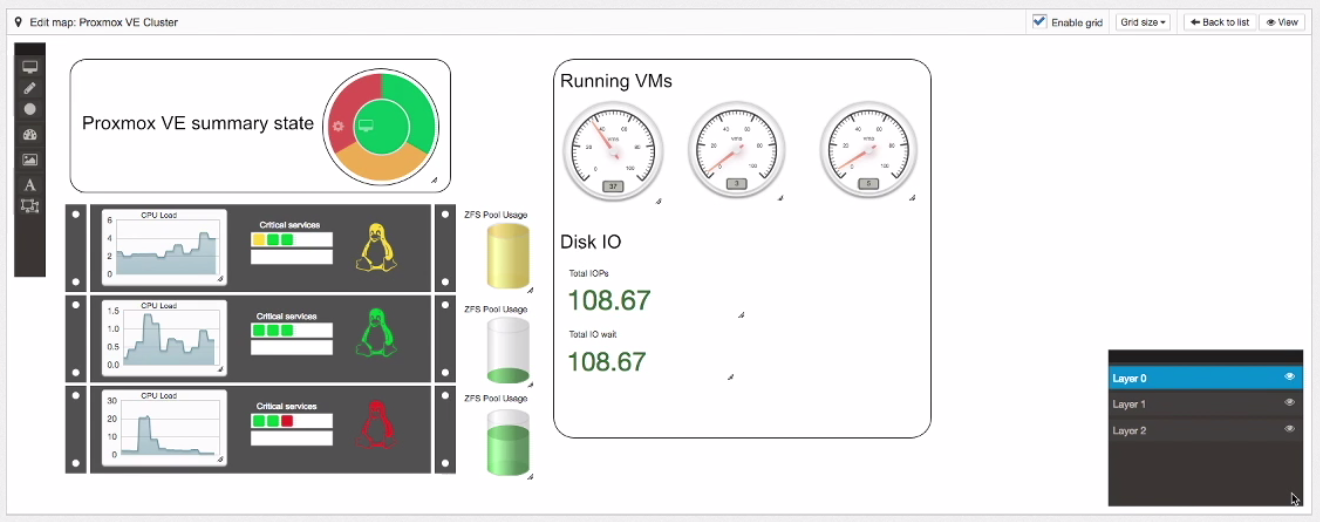
We are introducing our brand new map module. For detailed information about what has changed or what new features are available, please read the dedicated article.
Anonymous statistics
As already descripted in one of our previous blog posts, openITCOCKPIT 3.5 will ask you to send anonymous usage statistics to the developers.
By default, this option is disabled. We hope that many systems will provide us data, which we can use to improve performance of openITCOCKPIT.
Many thanks for your support!
Graphing
We have done various improvements to our graphs and charts.
New JavaScript based charts
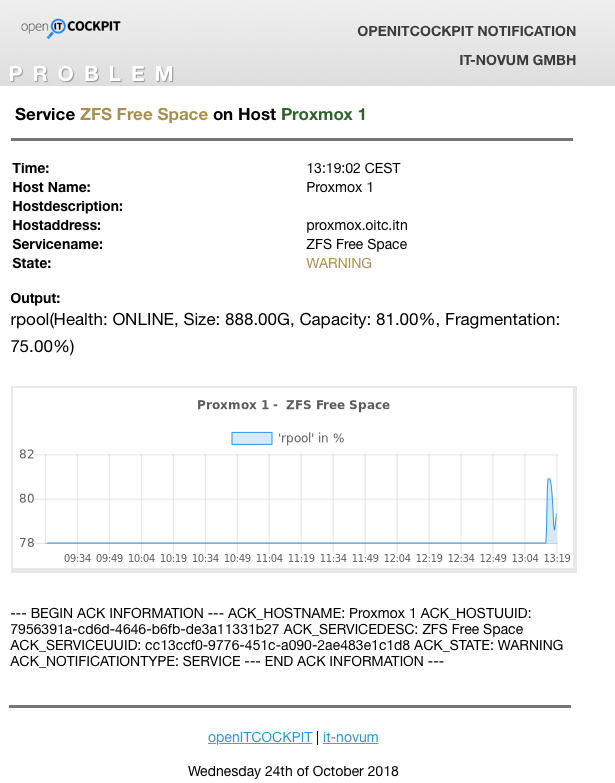
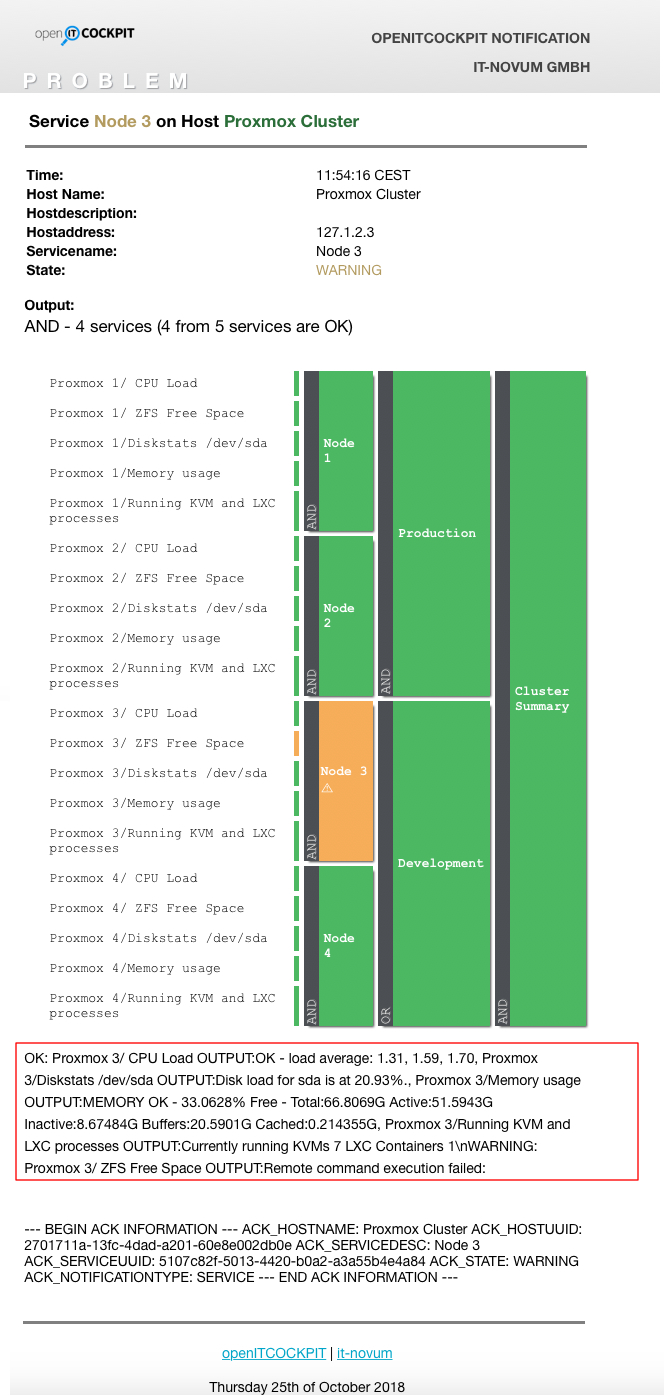
All charts will be rendered by JavaScript to provide a better user experience and a modern design. This also includes Autoreports and email notifications.
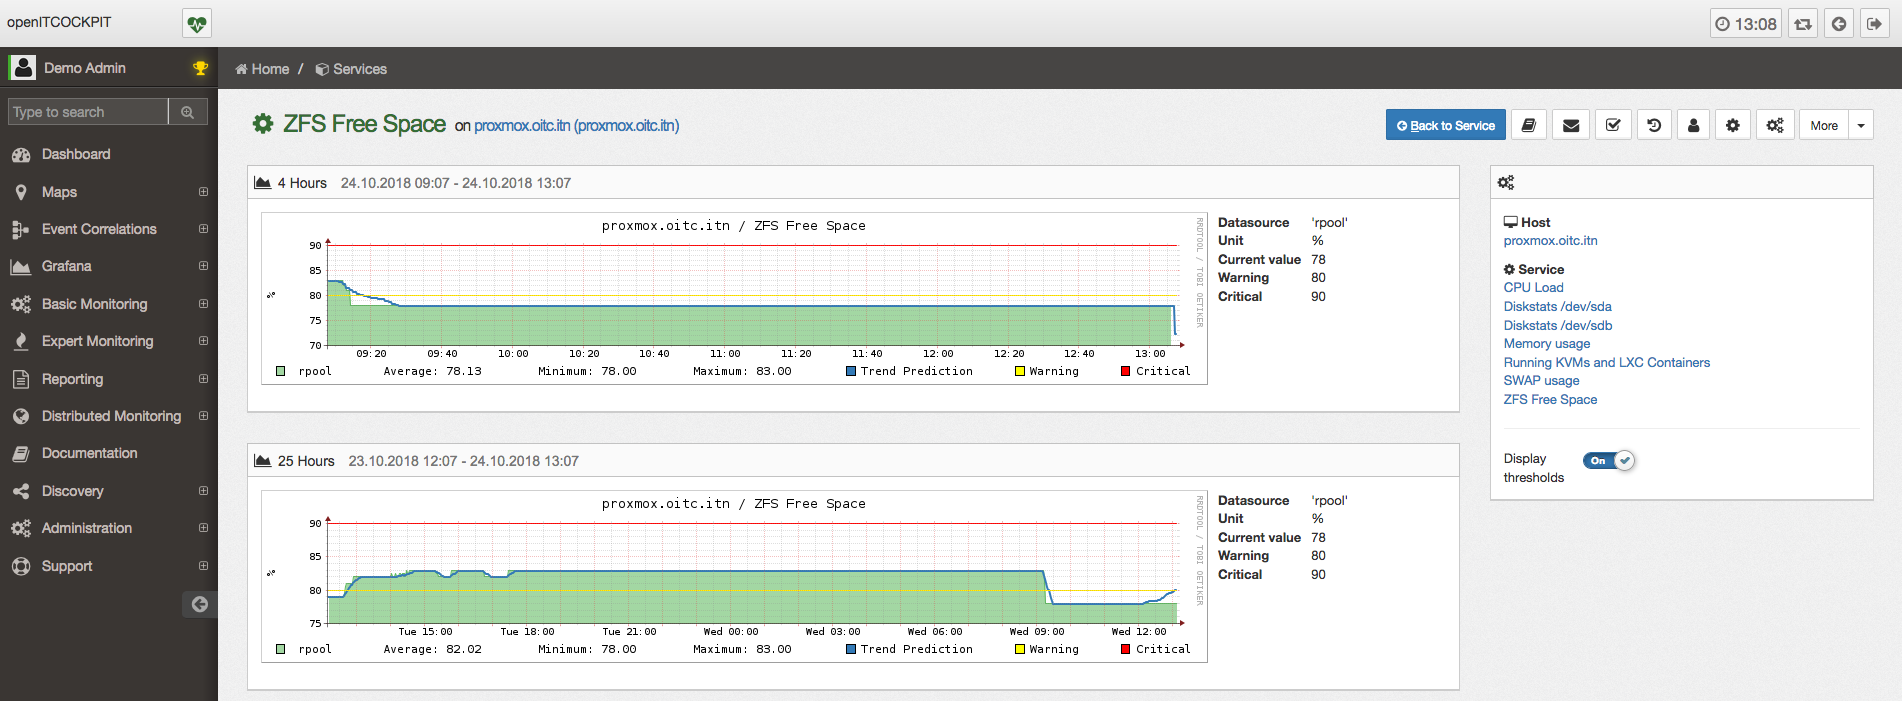
Service example
In addition, the main service chart can now display data points, auto refresh data, thresholds and much more.
Example email notification
Graphite for time-series (replacement of RRDtool)
With the next version of openITCOCKPIT (3.6), Graphite will become the new default database to store time-series data and it will replace RRDtool.
Removed “Grapher”
The Grapher has been removed completely. Grafana will help you to build much better views and dashboards.
Minor UI improvements
- button in host and services index list
- New
Configurationmenu. - Update documentation
EVC email notifications now also contain the original service output.
Known Issues
There is currently a bug in the rrdtool output, that the min/max/avg values are the same. Therefore, there is no difference in the output of min/max/avg in reports.
Add support for Ubuntu Bionic 18.04
We added packages for Ubuntu Bionic to to our public repository.
Drop support of Ubuntu Trusty
Official end of life of Ubuntu Trusty scheduled for April 2019.
Therefore openITCOCKPIT 3.5 will be the last release for Ubuntu Trusty. Please update to Ubuntu Xenial to receive further updates.
Drop support of Debian Jessie
Debian Jessie is not supported by the Debian security team anymore!
Therefore openITCOCKPIT 3.5 will be the last release for Debian Jessie. Please update to Debian Stretch to receive further updates.
Need help updating your system? Please don’t hesitate to contact our enterprise support support@itsm.it-novum.com
How to Update
In one of our previous articles we described how to update an installation of openITCOCKPIT in detail. If you are already familiar with our update process, you can update to the new version in three easy steps:
tmux
sudo apt-get update
sudo apt-get dist-upgrade
