openITCOCKPIT 4.6.7 released
Our latest release comes packed with exciting new features, improved functionality, and bug fixes that make it the best version yet. 🥰
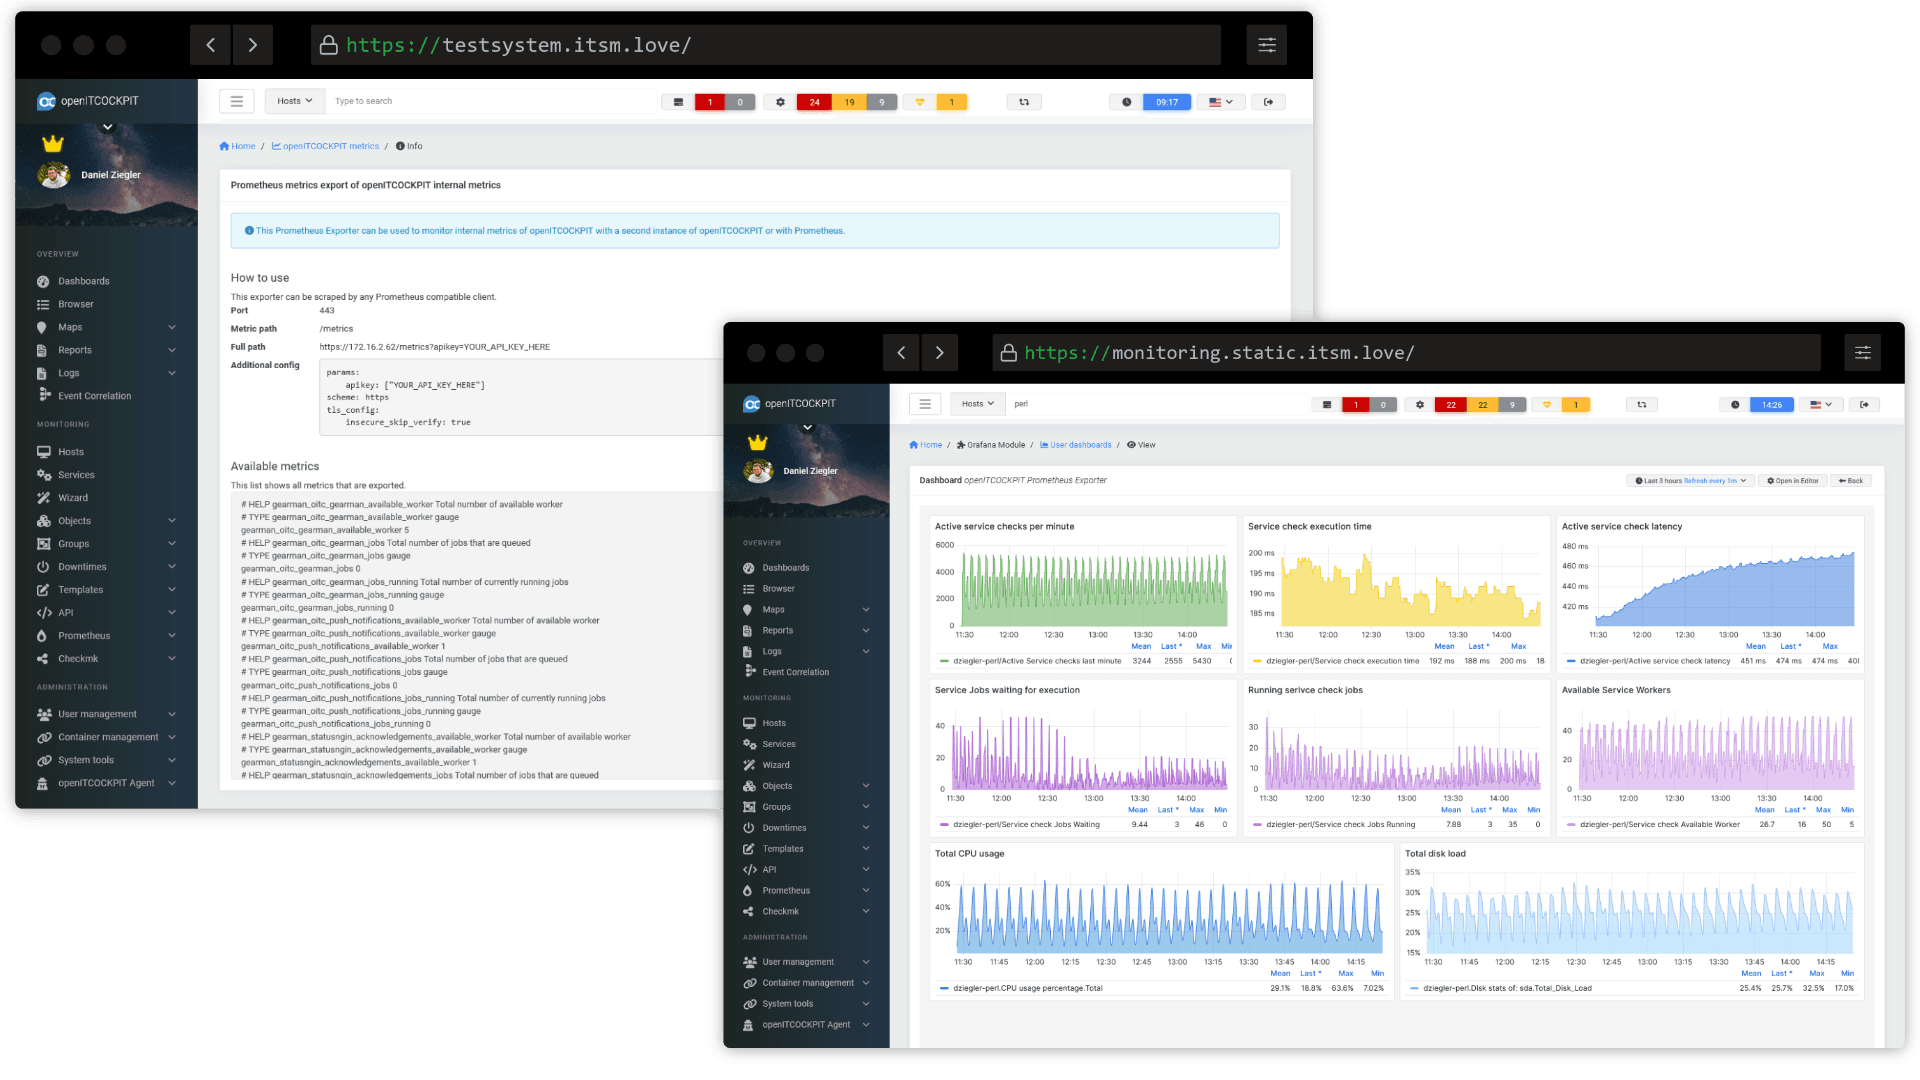
Integrated Prometheus exporter
openITCOCKPIT has now a inbuilt Prometheus exporter, which provides performance information about openITCOCKPIT itself. This can be useful, if you are administering a bunch of openITCOCKPIT instances or for doing load and performance tests.
The metrics endpoint is /metrics and can only be accessed by logged in users, or with a valid API-Key.
More information can be found unter System -> Prometheus Metrics.
Show Downtimes in Autoreports
In previous versions of openITCOCKPIT, the global settings of AUTOREPORTS_SHOW_OUTAGES_IN_DOWNTIME and AUTOREPORTS_SHOW_DOWNTIMES where ignored by the Autoreport Module.
Auto Reports were always listening downtime and outages that occured while the host or services was in a scheduled downtime.
This issue got resolved and you can now determine if the report should display downtime information or not.
IPv6 Support for the openITCOCKPIT Monitoring Agent
While the openITCOCKPIT Monitoring Agent itself has native support for IPv6, the openITCOCKPIT frontend had some issues, when an IPv6 address was passed. This issue only affected IPv6 addresses. If an hostname was used, which resolved into an IPv6 address, the issue was not present.
SLA Reporting used wrong total time
Under some condition, it could happen the the SLA Module was using a wrong value for the total evaluation time. This has been resolved.
Changelog of Hosts
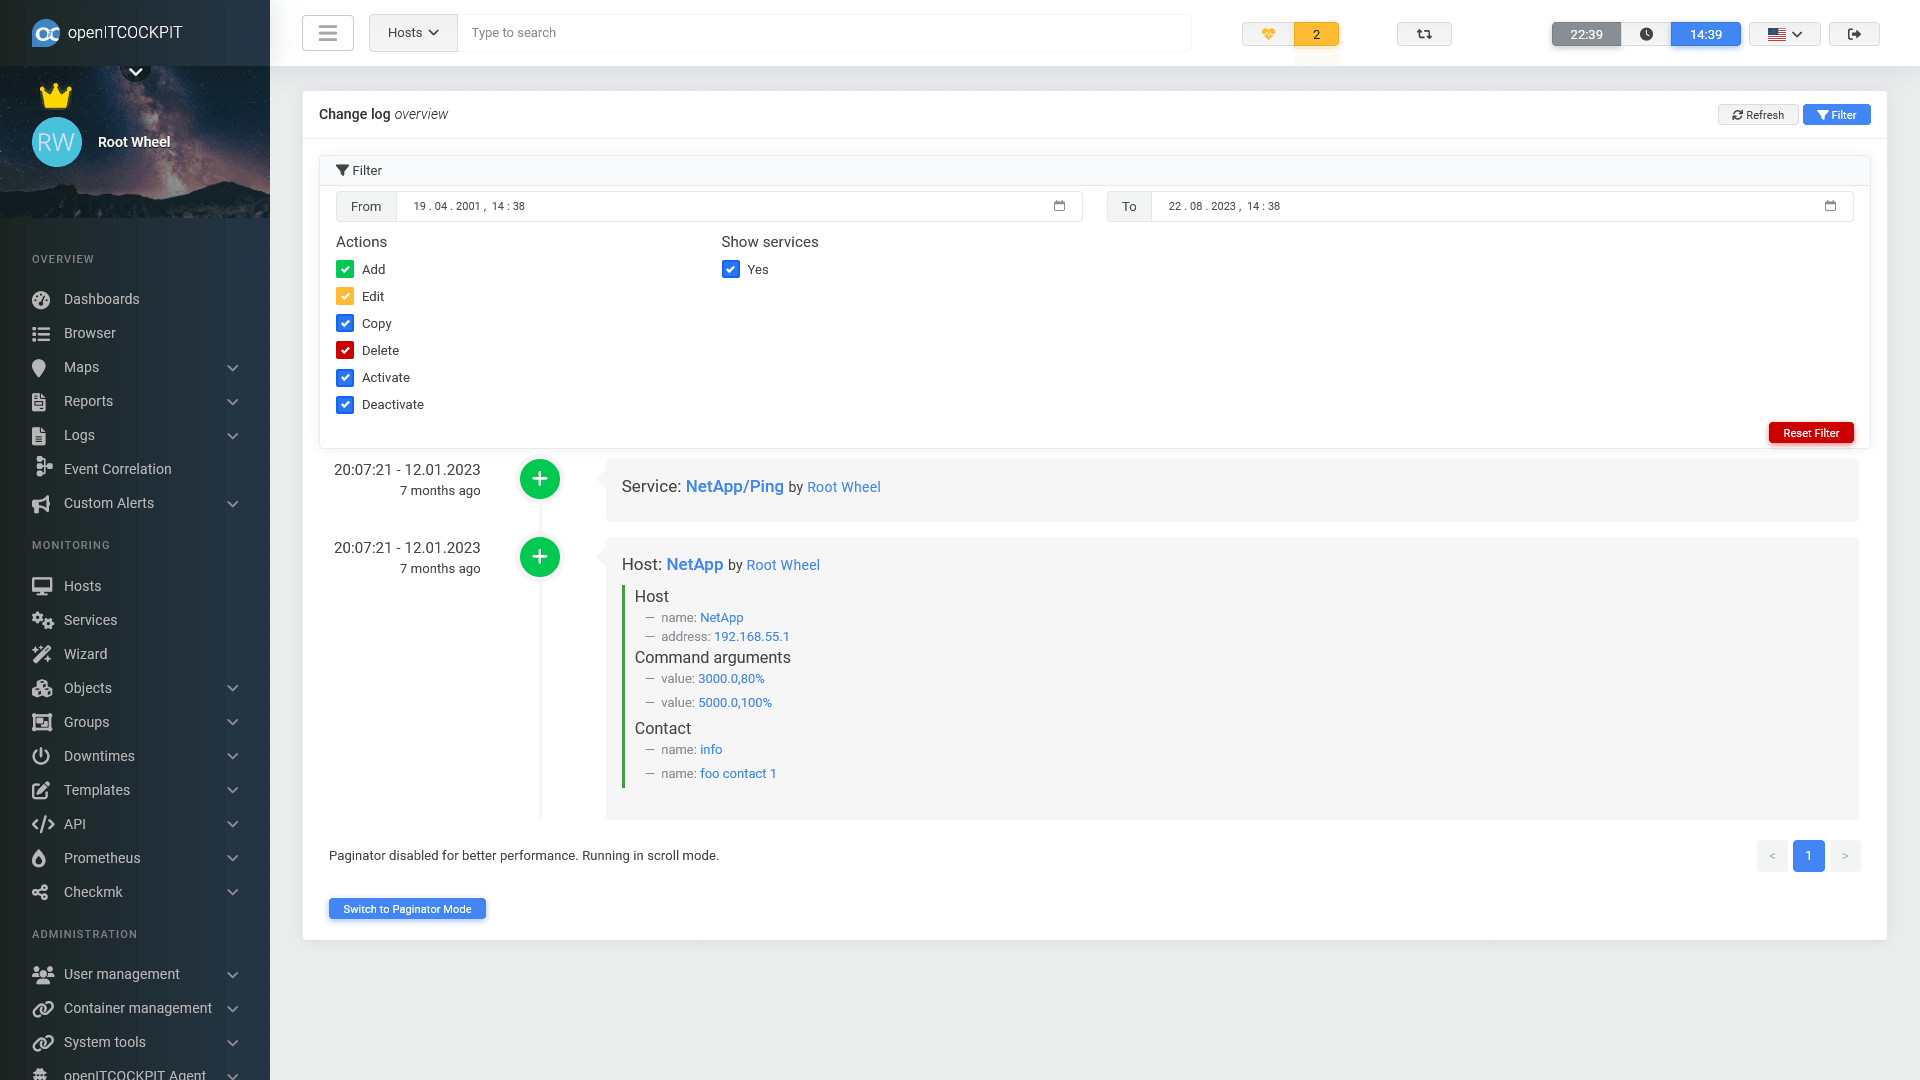
With openITCOCKPIT 4.6.6 we introduced a quick link to the changelog for every configuration object such as Commands, Hosts, Services, Contacts etc. For the Changelog of Hosts, we have added an option, to also include the Services of the selected host.
Map Module
We resolved an issue, where BB-Code-Links where rendered as text instead of a clickable link.
Bugfixes and improvements
Please see the changelog for a complete list of new features, fixed bugs and improvements.
How to Update
Please see the official documentation of how to update openITCOCKPIT.
Your openITCOCKPIT Team


